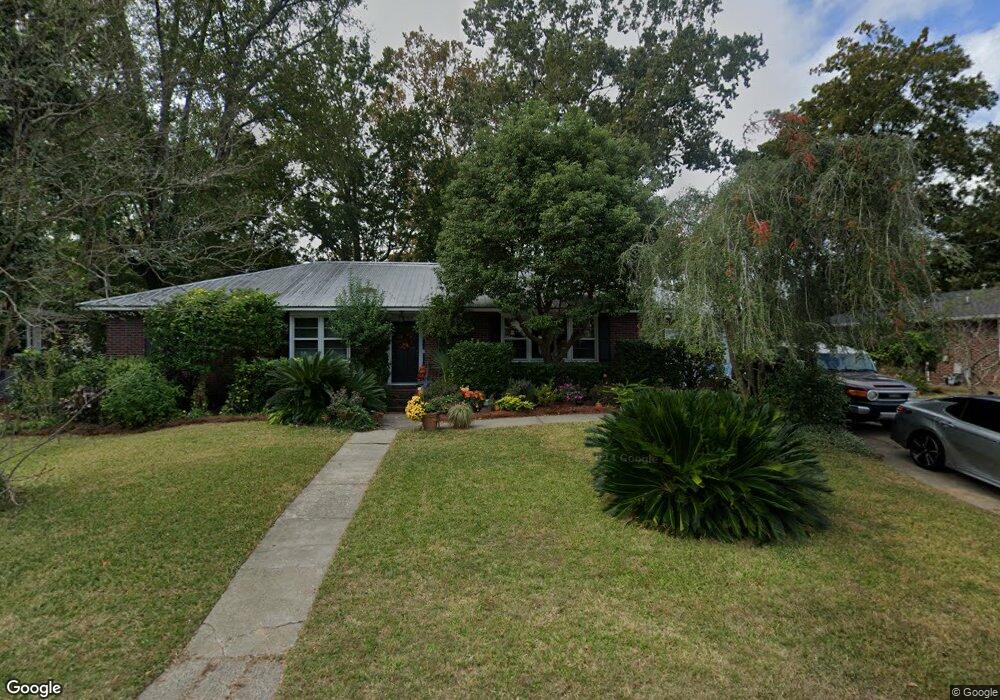
4951 France Ave North Charleston, SC 29405
Park Circle NeighborhoodEstimated Value: $567,000 - $695,000
3
Beds
2
Baths
1,690
Sq Ft
$377/Sq Ft
Est. Value
About This Home
This home is located at 4951 France Ave, North Charleston, SC 29405 and is currently estimated at $636,925, approximately $376 per square foot. 4951 France Ave is a home located in Charleston County with nearby schools including North Charleston Elementary School, Morningside Middle, and North Charleston High.
Ownership History
Date
Name
Owned For
Owner Type
Purchase Details
Closed on
Jul 27, 2012
Sold by
Williams Robert J
Bought by
Williams Robert J and Norton Ronie K
Current Estimated Value
Purchase Details
Closed on
Jul 22, 2011
Sold by
H & C Development Group Inc
Bought by
Williams Robert J
Home Financials for this Owner
Home Financials are based on the most recent Mortgage that was taken out on this home.
Original Mortgage
$191,031
Outstanding Balance
$130,552
Interest Rate
4.37%
Mortgage Type
FHA
Estimated Equity
$506,373
Purchase Details
Closed on
Dec 28, 2010
Sold by
Household Finance Corporation Ii
Bought by
H & C Development Group Inc
Home Financials for this Owner
Home Financials are based on the most recent Mortgage that was taken out on this home.
Original Mortgage
$42,184
Interest Rate
4.66%
Mortgage Type
Purchase Money Mortgage
Purchase Details
Closed on
Jun 21, 2010
Sold by
Simmons Iii Lewis Hugh and Simmons Mary Alyce
Bought by
Household Finance Corporation Ii
Create a Home Valuation Report for This Property
The Home Valuation Report is an in-depth analysis detailing your home's value as well as a comparison with similar homes in the area
Home Values in the Area
Average Home Value in this Area
Purchase History
| Date | Buyer | Sale Price | Title Company |
|---|---|---|---|
| Williams Robert J | -- | -- | |
| Williams Robert J | $196,000 | -- | |
| H & C Development Group Inc | $84,000 | -- | |
| Household Finance Corporation Ii | $90,465 | -- |
Source: Public Records
Mortgage History
| Date | Status | Borrower | Loan Amount |
|---|---|---|---|
| Open | Williams Robert J | $191,031 | |
| Previous Owner | H & C Development Group Inc | $42,184 |
Source: Public Records
Tax History Compared to Growth
Tax History
| Year | Tax Paid | Tax Assessment Tax Assessment Total Assessment is a certain percentage of the fair market value that is determined by local assessors to be the total taxable value of land and additions on the property. | Land | Improvement |
|---|---|---|---|---|
| 2024 | $1,409 | $9,020 | $0 | $0 |
| 2023 | $1,409 | $9,020 | $0 | $0 |
| 2022 | $1,349 | $9,020 | $0 | $0 |
| 2021 | $1,403 | $9,020 | $0 | $0 |
| 2020 | $1,439 | $9,020 | $0 | $0 |
| 2019 | $1,275 | $7,840 | $0 | $0 |
| 2017 | $1,202 | $7,840 | $0 | $0 |
| 2016 | $1,160 | $7,840 | $0 | $0 |
| 2015 | $1,215 | $7,840 | $0 | $0 |
| 2014 | $1,180 | $0 | $0 | $0 |
| 2011 | -- | $0 | $0 | $0 |
Source: Public Records
Map
Nearby Homes
- 4968 Victoria Ave
- 4915 Ashby Ave
- 1183 Arant St
- 1159 North Blvd
- 4819 Boulevard Ln
- 5109 Victoria Ave
- 1657 E Montague Ave
- 5069 Draper St
- 5110 Temple St
- 1226 Maxwell St
- 1222 Maxwell St
- 4745 Churchill Rd
- 5119 Parkside Dr
- 5000 Pittman St
- 4714 Marlboro Rd
- 4728 Mixson Ave
- 5006 Durant Ave
- 1181 Park Place S
- 5016 Durant Ave
- 4625 Durant Ave
- 4947 France Ave
- 4961 France Ave
- 4954 Ashby Ave
- 4948 Ashby Ave
- 4950 France Ave
- 4948 France Ave
- 4956 France Ave
- 4939 France Ave
- 4965 France Ave
- 4940 Ashby Ave
- 4966 Ashby Ave
- 4940 France Ave
- 4964 France Ave
- 4959 Victoria Ave
- 4953 Ashby Ave
- 4951 Victoria Ave
- 4965 Victoria Ave
- 4961 Ashby Ave
- 4947 Ashby Ave
- 4947 Victoria Ave