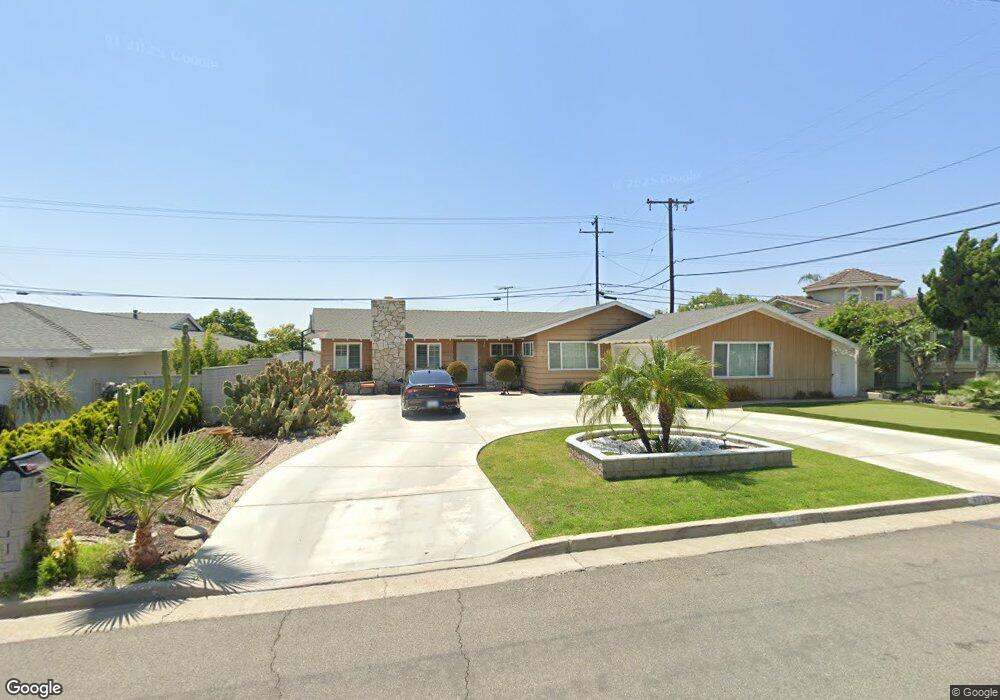
4951 Ridglea Ave Buena Park, CA 90621
Estimated Value: $950,042 - $1,247,000
3
Beds
2
Baths
1,773
Sq Ft
$611/Sq Ft
Est. Value
About This Home
This home is located at 4951 Ridglea Ave, Buena Park, CA 90621 and is currently estimated at $1,083,761, approximately $611 per square foot. 4951 Ridglea Ave is a home located in Orange County with nearby schools including Charles G. Emery Elementary School, Buena Park Junior High School, and Sunny Hills High School.
Ownership History
Date
Name
Owned For
Owner Type
Purchase Details
Closed on
Apr 3, 2013
Sold by
Oliver Janice
Bought by
Oliver Janice and Janice Oliver Revocable Living Trust
Current Estimated Value
Home Financials for this Owner
Home Financials are based on the most recent Mortgage that was taken out on this home.
Original Mortgage
$221,500
Outstanding Balance
$46,790
Interest Rate
3.47%
Mortgage Type
New Conventional
Estimated Equity
$1,036,971
Purchase Details
Closed on
May 19, 2008
Sold by
Oliver Janice E
Bought by
Oliver Janice and The Janice Oliver Revocable Living Trust
Purchase Details
Closed on
Jan 21, 1997
Sold by
Oliver Janice E
Bought by
Oliver Janice E
Home Financials for this Owner
Home Financials are based on the most recent Mortgage that was taken out on this home.
Original Mortgage
$180,000
Interest Rate
7.58%
Purchase Details
Closed on
Aug 14, 1996
Sold by
Mcneely Howard
Bought by
Oliver Janice E
Create a Home Valuation Report for This Property
The Home Valuation Report is an in-depth analysis detailing your home's value as well as a comparison with similar homes in the area
Home Values in the Area
Average Home Value in this Area
Purchase History
| Date | Buyer | Sale Price | Title Company |
|---|---|---|---|
| Oliver Janice | -- | Accommodation | |
| Oliver Janice | -- | Fidelity National Title | |
| Oliver Janice | -- | None Available | |
| Oliver Janice E | -- | First American Title Ins Co | |
| Oliver Janice E | -- | -- |
Source: Public Records
Mortgage History
| Date | Status | Borrower | Loan Amount |
|---|---|---|---|
| Open | Oliver Janice | $221,500 | |
| Closed | Oliver Janice E | $180,000 |
Source: Public Records
Tax History Compared to Growth
Tax History
| Year | Tax Paid | Tax Assessment Tax Assessment Total Assessment is a certain percentage of the fair market value that is determined by local assessors to be the total taxable value of land and additions on the property. | Land | Improvement |
|---|---|---|---|---|
| 2025 | $4,154 | $362,139 | $217,676 | $144,463 |
| 2024 | $4,154 | $355,039 | $213,408 | $141,631 |
| 2023 | $4,066 | $348,078 | $209,224 | $138,854 |
| 2022 | $3,998 | $341,253 | $205,121 | $136,132 |
| 2021 | $3,967 | $334,562 | $201,099 | $133,463 |
| 2020 | $3,918 | $331,132 | $199,037 | $132,095 |
| 2019 | $3,825 | $324,640 | $195,135 | $129,505 |
| 2018 | $3,751 | $318,275 | $191,309 | $126,966 |
| 2017 | $3,697 | $312,035 | $187,558 | $124,477 |
| 2016 | $3,623 | $305,917 | $183,880 | $122,037 |
| 2015 | $3,467 | $301,322 | $181,118 | $120,204 |
| 2014 | $3,453 | $295,420 | $177,570 | $117,850 |
Source: Public Records
Map
Nearby Homes
- 8244 Henderson Green
- 4900 Lincolnshire Ave
- 4738 Durango Dr
- 5211 Fox Hills Ave
- 5412 Arrowhead Ave
- 14806 Faceta Dr
- 2150 Cheyenne Way Unit 169
- 14724 Mercado Ave
- 8237 Henshaw Cir
- 14828 Rayfield Dr
- 2200 Cheyenne Way Unit 117
- 8542 Emerywood Dr
- 5588 Cajon Ave
- 15213 Santa Gertrudes Ave Unit W106
- 15233 Santa Gertrudes Ave
- 5471 Jonesboro Way
- 9 Coveside Ct
- 15220 Ocaso Ave Unit H103
- 15224 Ocaso Ave Unit H212
- 15011 La Mesa Dr
- 4971 Ridglea Ave
- 4941 Ridglea Ave
- 4974 Argyle Dr
- 4980 Argyle Dr
- 4968 Argyle Dr
- 4986 Argyle Dr
- 4992 Argyle Way
- 4992 Argyle Dr
- 4962 Argyle Dr
- 4998 Argyle Dr
- 4956 Argyle Dr
- 5004 Argyle Dr
- 4950 Argyle Way
- 4981 Ridglea Ave
- 4950 Argyle Dr
- 4921 Ridglea Ave
- 4958 Ridglea Ave
- 4944 Argyle Dr
- 4938 Argyle Dr
- 4938 Ridglea Ave