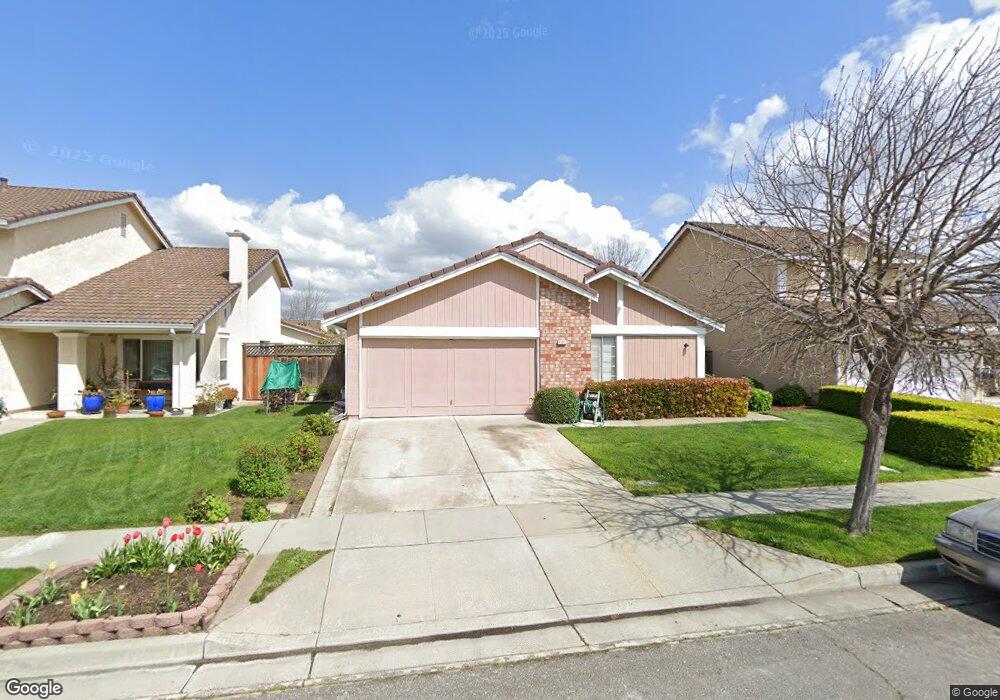
4952 Friar Ave Fremont, CA 94555
Ardenwood NeighborhoodEstimated Value: $1,352,643 - $1,679,000
3
Beds
2
Baths
1,380
Sq Ft
$1,094/Sq Ft
Est. Value
About This Home
This home is located at 4952 Friar Ave, Fremont, CA 94555 and is currently estimated at $1,509,661, approximately $1,093 per square foot. 4952 Friar Ave is a home located in Alameda County with nearby schools including Ardenwood Elementary, Thornton Middle School, and American High School.
Ownership History
Date
Name
Owned For
Owner Type
Purchase Details
Closed on
Oct 27, 2023
Sold by
Kalra Om Parkash and Kalra Darshan
Bought by
Om Parkash Kalra And Darshan Kalra 2017 Livin and Kalra
Current Estimated Value
Purchase Details
Closed on
Sep 3, 2014
Sold by
Kalra Anjay
Bought by
Kalra Om and Kalra Darshan
Purchase Details
Closed on
Dec 27, 2010
Sold by
Kalra Om Parkash and Kalra Darshan
Bought by
Kalra Anjay
Purchase Details
Closed on
Oct 18, 2008
Sold by
Kalra Anjay
Bought by
Kalra Om and Kalra Darshan
Purchase Details
Closed on
Aug 17, 1998
Sold by
Lee Peter K and Lee Diana M
Bought by
Kalba Anjay
Home Financials for this Owner
Home Financials are based on the most recent Mortgage that was taken out on this home.
Original Mortgage
$224,000
Interest Rate
6.88%
Create a Home Valuation Report for This Property
The Home Valuation Report is an in-depth analysis detailing your home's value as well as a comparison with similar homes in the area
Home Values in the Area
Average Home Value in this Area
Purchase History
| Date | Buyer | Sale Price | Title Company |
|---|---|---|---|
| Om Parkash Kalra And Darshan Kalra 2017 Livin | -- | None Listed On Document | |
| Kalra Om | -- | None Available | |
| Kalra Anjay | -- | None Available | |
| Kalra Om | -- | None Available | |
| Kalba Anjay | $280,000 | First American Title Guarant |
Source: Public Records
Mortgage History
| Date | Status | Borrower | Loan Amount |
|---|---|---|---|
| Previous Owner | Kalba Anjay | $224,000 |
Source: Public Records
Tax History Compared to Growth
Tax History
| Year | Tax Paid | Tax Assessment Tax Assessment Total Assessment is a certain percentage of the fair market value that is determined by local assessors to be the total taxable value of land and additions on the property. | Land | Improvement |
|---|---|---|---|---|
| 2025 | $5,696 | $438,933 | $131,680 | $307,253 |
| 2024 | $5,696 | $430,328 | $129,098 | $301,230 |
| 2023 | $5,533 | $421,891 | $126,567 | $295,324 |
| 2022 | $5,447 | $413,621 | $124,086 | $289,535 |
| 2021 | $5,318 | $405,511 | $121,653 | $283,858 |
| 2020 | $5,283 | $401,354 | $120,406 | $280,948 |
| 2019 | $5,226 | $393,486 | $118,046 | $275,440 |
| 2018 | $5,123 | $385,771 | $115,731 | $270,040 |
| 2017 | $4,996 | $378,210 | $113,463 | $264,747 |
| 2016 | $4,904 | $370,794 | $111,238 | $259,556 |
| 2015 | $4,832 | $365,225 | $109,567 | $255,658 |
| 2014 | $4,661 | $358,071 | $107,421 | $250,650 |
Source: Public Records
Map
Nearby Homes
- 4744 Touchstone Terrace
- 5301 Shamrock Common
- 4512 Macbeth Ave
- 34648 Musk Terrace
- 34198 Tony Terrace
- 34565 Pueblo Terrace
- 5220 Fairbanks Common
- 34607 Pueblo Terrace
- 34627 Pueblo Terrace
- 5176 Tacoma Common
- 5308 Tacoma Common
- 33018 Soquel St
- 4141 Deep Creek Rd Unit 137
- 5621 Via Lugano
- 34192 Firenze Terrace
- 32945 Regents Blvd
- 4243 Nerissa Cir
- 34768 Swain Common
- 34102 Zaner Way
- 33064 Compton Ct
- 4948 Friar Ave
- 4956 Friar Ave
- 4903 Montague Ave
- 4944 Friar Ave
- 4960 Friar Ave
- 4907 Montague Ave
- 4899 Montague Ave
- 4911 Montague Ave
- 4895 Montague Ave
- 4951 Friar Ave
- 4940 Friar Ave
- 4964 Friar Ave
- 4947 Friar Ave
- 4955 Friar Ave
- 4943 Friar Ave
- 4891 Montague Ave
- 4915 Montague Ave
- 4936 Friar Ave
- 4939 Friar Ave
- 4968 Friar Ave