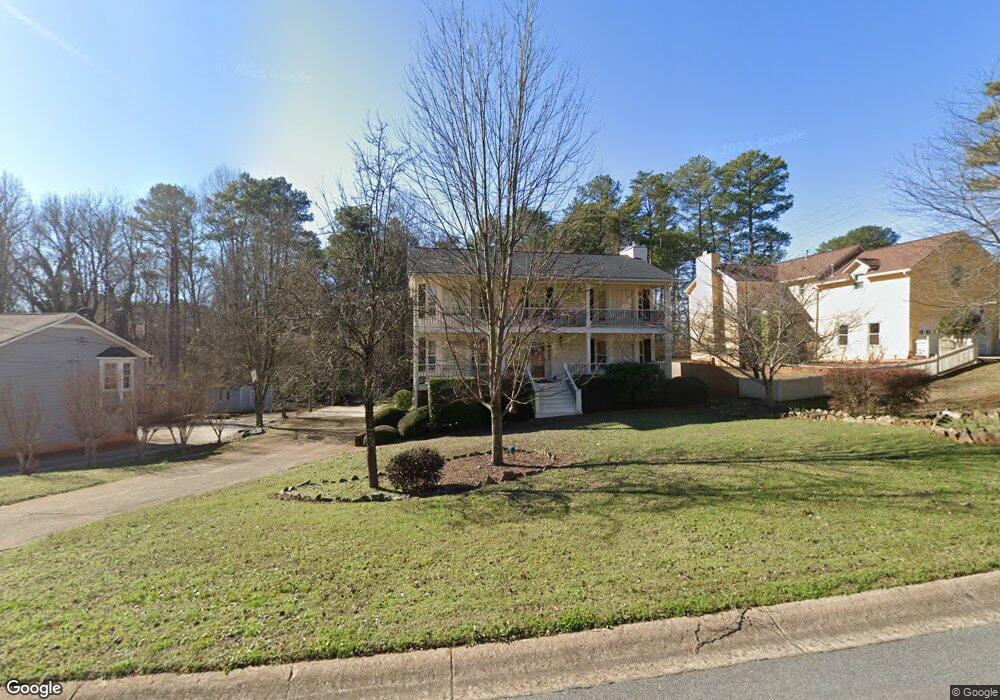
4953 Highpoint Way NE Unit 4 Marietta, GA 30066
Sandy Plains NeighborhoodEstimated Value: $467,615 - $500,000
5
Beds
4
Baths
2,857
Sq Ft
$168/Sq Ft
Est. Value
About This Home
This home is located at 4953 Highpoint Way NE Unit 4, Marietta, GA 30066 and is currently estimated at $480,404, approximately $168 per square foot. 4953 Highpoint Way NE Unit 4 is a home located in Cobb County with nearby schools including Keheley Elementary School, McCleskey Middle School, and The Garden School.
Ownership History
Date
Name
Owned For
Owner Type
Purchase Details
Closed on
Mar 24, 2016
Sold by
Chambless Theresa Ann
Bought by
Taylor Yvonne
Current Estimated Value
Home Financials for this Owner
Home Financials are based on the most recent Mortgage that was taken out on this home.
Original Mortgage
$240,562
Outstanding Balance
$195,604
Interest Rate
4.5%
Mortgage Type
FHA
Estimated Equity
$284,800
Purchase Details
Closed on
Feb 26, 2009
Sold by
Billoni Joseph J and Billoni Advie D
Bought by
Leary Theresa
Home Financials for this Owner
Home Financials are based on the most recent Mortgage that was taken out on this home.
Original Mortgage
$208,650
Interest Rate
5.13%
Mortgage Type
FHA
Purchase Details
Closed on
May 31, 2000
Sold by
Gant Ray W and Gant Nancy A
Bought by
Billoni Joseph J and Billoni Advie D
Home Financials for this Owner
Home Financials are based on the most recent Mortgage that was taken out on this home.
Original Mortgage
$134,400
Interest Rate
8.14%
Mortgage Type
New Conventional
Create a Home Valuation Report for This Property
The Home Valuation Report is an in-depth analysis detailing your home's value as well as a comparison with similar homes in the area
Home Values in the Area
Average Home Value in this Area
Purchase History
| Date | Buyer | Sale Price | Title Company |
|---|---|---|---|
| Taylor Yvonne | $245,000 | -- | |
| Leary Theresa | $212,500 | -- | |
| Billoni Joseph J | $168,000 | -- |
Source: Public Records
Mortgage History
| Date | Status | Borrower | Loan Amount |
|---|---|---|---|
| Open | Taylor Yvonne | $240,562 | |
| Previous Owner | Leary Theresa | $208,650 | |
| Previous Owner | Billoni Joseph J | $134,400 |
Source: Public Records
Tax History Compared to Growth
Tax History
| Year | Tax Paid | Tax Assessment Tax Assessment Total Assessment is a certain percentage of the fair market value that is determined by local assessors to be the total taxable value of land and additions on the property. | Land | Improvement |
|---|---|---|---|---|
| 2025 | $6,228 | $206,716 | $36,000 | $170,716 |
| 2024 | $4,761 | $157,924 | $34,400 | $123,524 |
| 2023 | $4,761 | $157,924 | $34,400 | $123,524 |
| 2022 | $4,335 | $142,840 | $28,000 | $114,840 |
| 2021 | $3,769 | $124,200 | $28,000 | $96,200 |
| 2020 | $3,272 | $107,800 | $26,000 | $81,800 |
| 2019 | $3,272 | $107,800 | $26,000 | $81,800 |
| 2018 | $3,080 | $101,492 | $26,000 | $75,492 |
| 2017 | $2,818 | $98,000 | $25,080 | $72,920 |
| 2016 | $2,918 | $101,492 | $26,000 | $75,492 |
| 2015 | $2,447 | $83,056 | $20,000 | $63,056 |
Source: Public Records
Map
Nearby Homes
- 4813 Highpoint Dr NE
- 4799 North Trail
- 4797 North Trail
- 5100 Ravenwood Dr
- 5009 Kingsley Manor Ct
- 1877 Falcon Wood Dr NE
- 205 Leland Way
- 4924 Locklear Way
- 2256 Turtle Club Dr NE Unit 1
- 4592 N Landing Dr
- 2423 Turtle Crossing NE
- 4709 Trickum Rd NE
- 134 Sierra Cir
- 223 Wild Ginger Bend
- 235 Wild Ginger Bend
- 416 Maypop Ln
- 156 W Oaks Place
- 4953 Highpoint Way NE
- 4951 Highpoint Way NE
- 4955 Highpoint Way NE Unit 4
- 0 Highpoint Way NE Unit 8271458
- 0 Highpoint Way NE
- 4949 Highpoint Way NE
- 4956 Highpoint Way NE
- 2056 Jamerson Rd
- 4947 Highpoint Way NE
- 4952 Highpoint Way NE
- 4954 Highpoint Way NE
- 1915 Falcon Wood Dr NE
- 1913 Falcon Wood Dr NE
- 4950 Highpoint Way NE
- 1911 Falcon Wood Dr NE
- 2100 Jamerson Rd
- 1917 Falcon Wood Dr NE
- 4945 Highpoint Way NE Unit 4945
- 4945 Highpoint Way NE
- 4945 Highpoint Way NE