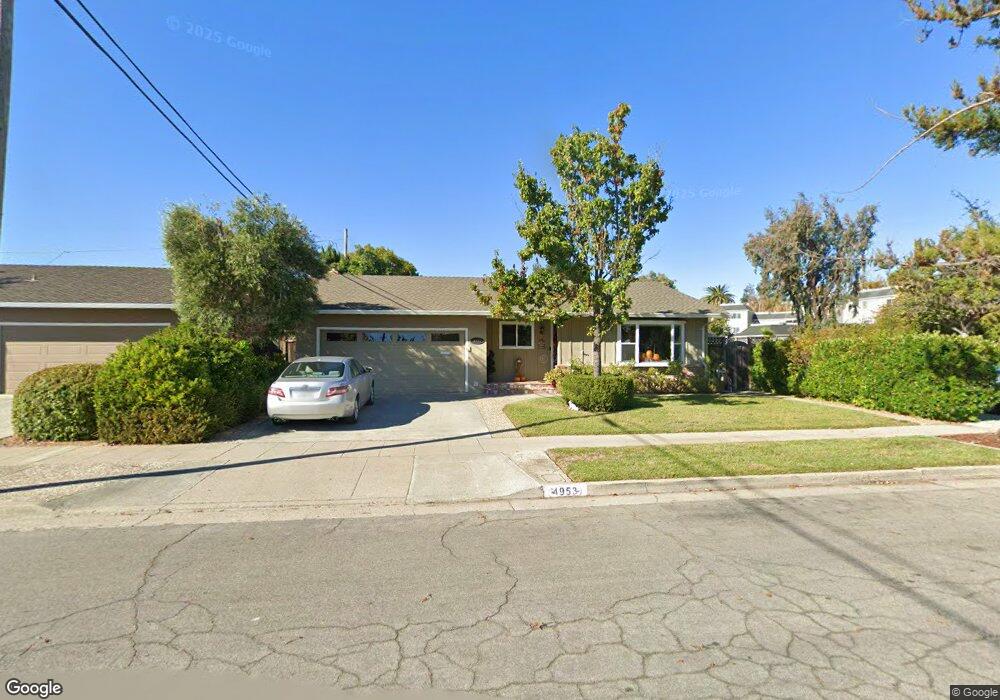
4953 Mise Ave San Jose, CA 95124
De Voss-Leigh NeighborhoodEstimated Value: $1,919,000 - $2,396,000
4
Beds
2
Baths
1,672
Sq Ft
$1,257/Sq Ft
Est. Value
About This Home
This home is located at 4953 Mise Ave, San Jose, CA 95124 and is currently estimated at $2,101,704, approximately $1,257 per square foot. 4953 Mise Ave is a home located in Santa Clara County with nearby schools including Carlton Elementary School, Union Middle School, and Leigh High School.
Ownership History
Date
Name
Owned For
Owner Type
Purchase Details
Closed on
Jul 27, 2004
Sold by
Lampros Nick and Lampros Linda
Bought by
Carlton James A and Carlton Rebecca E
Current Estimated Value
Home Financials for this Owner
Home Financials are based on the most recent Mortgage that was taken out on this home.
Original Mortgage
$596,000
Outstanding Balance
$290,632
Interest Rate
5.75%
Mortgage Type
Purchase Money Mortgage
Estimated Equity
$1,811,072
Purchase Details
Closed on
Mar 24, 2004
Sold by
Tzitz Sylvia Ellen
Bought by
Lampros Nick and Lampros Linda
Home Financials for this Owner
Home Financials are based on the most recent Mortgage that was taken out on this home.
Original Mortgage
$416,000
Interest Rate
3.75%
Mortgage Type
Purchase Money Mortgage
Purchase Details
Closed on
Jun 19, 1998
Sold by
Kear Evelyn R
Bought by
Kear Evelyn Ruth
Purchase Details
Closed on
Apr 7, 1998
Sold by
Kear Evelyn R
Bought by
Kear Evelyn Ruth
Create a Home Valuation Report for This Property
The Home Valuation Report is an in-depth analysis detailing your home's value as well as a comparison with similar homes in the area
Home Values in the Area
Average Home Value in this Area
Purchase History
| Date | Buyer | Sale Price | Title Company |
|---|---|---|---|
| Carlton James A | $745,000 | Stewart Title Of California | |
| Lampros Nick | $520,000 | First American Title Company | |
| Kear Evelyn Ruth | -- | -- | |
| Kear Evelyn Ruth | -- | -- |
Source: Public Records
Mortgage History
| Date | Status | Borrower | Loan Amount |
|---|---|---|---|
| Open | Carlton James A | $596,000 | |
| Previous Owner | Lampros Nick | $416,000 | |
| Closed | Lampros Nick | $52,000 | |
| Closed | Carlton James A | $111,750 |
Source: Public Records
Tax History Compared to Growth
Tax History
| Year | Tax Paid | Tax Assessment Tax Assessment Total Assessment is a certain percentage of the fair market value that is determined by local assessors to be the total taxable value of land and additions on the property. | Land | Improvement |
|---|---|---|---|---|
| 2025 | $14,447 | $1,038,450 | $557,556 | $480,894 |
| 2024 | $14,447 | $1,018,089 | $546,624 | $471,465 |
| 2023 | $14,150 | $998,127 | $535,906 | $462,221 |
| 2022 | $13,849 | $978,557 | $525,399 | $453,158 |
| 2021 | $13,576 | $959,371 | $515,098 | $444,273 |
| 2020 | $13,297 | $949,535 | $509,817 | $439,718 |
| 2019 | $13,063 | $930,918 | $499,821 | $431,097 |
| 2018 | $12,738 | $912,666 | $490,021 | $422,645 |
| 2017 | $12,573 | $894,771 | $480,413 | $414,358 |
| 2016 | $11,986 | $877,228 | $470,994 | $406,234 |
| 2015 | $11,795 | $864,052 | $463,920 | $400,132 |
| 2014 | $11,131 | $847,127 | $454,833 | $392,294 |
Source: Public Records
Map
Nearby Homes
- 1957 Wilfred Way
- 4867 Anna Dr
- 5222 Adalina Ct
- 4848 Anna Dr
- 102 Hildebrand Dr
- 4927 Leigh Ave
- 15236 Dickens Ave
- 14802 Cole Dr
- 1504 Love Ct
- 2026 Lynn Ave
- 2291 Samaritan Dr Unit 3
- 4593 Fallstone Ct
- 4768 Hatfield Walk Unit 2
- 2303 Saidel Dr Unit 4
- 4843 Pepperwood Way
- 4787 Hatfield Walkway Unit 4
- 14570 Wyrick Ave
- 2309 Saidel Dr Unit 2
- 1507 Love Ct
- 1500 Paradise Ct
- 4959 Mise Ave
- 4952 Stuckey Dr
- 4958 Stuckey Dr
- 4965 Mise Ave
- 4964 Stuckey Dr
- 4952 Mise Ave
- 4956 Mise Ave
- 4971 Mise Ave
- 4962 Mise Ave
- 4970 Stuckey Dr
- 4968 Mise Ave
- 4977 Mise Ave
- 4951 Stuckey Dr
- 4951 Kenlar Dr
- 4976 Stuckey Dr
- 4957 Stuckey Dr
- 4959 Kenlar Dr
- 4974 Mise Ave
- 1965 Heimgartner Ln
- 4963 Stuckey Dr