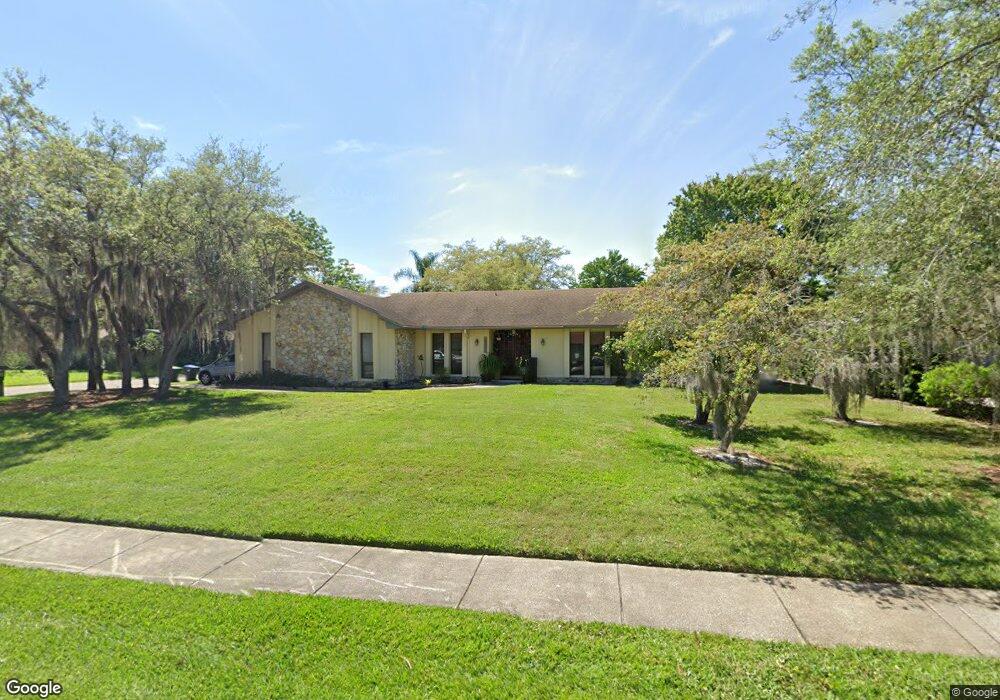
4954 Hidden Springs Blvd Orlando, FL 32819
Universal NeighborhoodEstimated Value: $525,257 - $576,000
3
Beds
2
Baths
2,808
Sq Ft
$197/Sq Ft
Est. Value
About This Home
This home is located at 4954 Hidden Springs Blvd, Orlando, FL 32819 and is currently estimated at $554,564, approximately $197 per square foot. 4954 Hidden Springs Blvd is a home located in Orange County with nearby schools including Palm Lake Elementary, Chain of Lakes Middle School, and Olympia High.
Ownership History
Date
Name
Owned For
Owner Type
Purchase Details
Closed on
Sep 6, 2016
Sold by
Mclemore Scott T and Mclemore Kimberly Paige
Bought by
Rubio Nathaniel and Sahagun Rubio Leticia
Current Estimated Value
Home Financials for this Owner
Home Financials are based on the most recent Mortgage that was taken out on this home.
Original Mortgage
$212,000
Outstanding Balance
$169,609
Interest Rate
3.48%
Mortgage Type
New Conventional
Estimated Equity
$384,955
Purchase Details
Closed on
Oct 9, 1997
Sold by
Beckenstein Neil A and Beckenstein Anita L
Bought by
Mclemore Scott T and Mclemore Kimberly P
Home Financials for this Owner
Home Financials are based on the most recent Mortgage that was taken out on this home.
Original Mortgage
$133,000
Interest Rate
7.6%
Mortgage Type
New Conventional
Create a Home Valuation Report for This Property
The Home Valuation Report is an in-depth analysis detailing your home's value as well as a comparison with similar homes in the area
Home Values in the Area
Average Home Value in this Area
Purchase History
| Date | Buyer | Sale Price | Title Company |
|---|---|---|---|
| Rubio Nathaniel | $265,000 | Equitable Title Of Dr Philli | |
| Mclemore Scott T | $140,000 | -- |
Source: Public Records
Mortgage History
| Date | Status | Borrower | Loan Amount |
|---|---|---|---|
| Open | Rubio Nathaniel | $212,000 | |
| Previous Owner | Mclemore Scott T | $142,000 | |
| Previous Owner | Mclemore Scott T | $133,000 |
Source: Public Records
Tax History Compared to Growth
Tax History
| Year | Tax Paid | Tax Assessment Tax Assessment Total Assessment is a certain percentage of the fair market value that is determined by local assessors to be the total taxable value of land and additions on the property. | Land | Improvement |
|---|---|---|---|---|
| 2025 | $4,677 | $309,307 | -- | -- |
| 2024 | $4,369 | $309,307 | -- | -- |
| 2023 | $4,369 | $291,835 | $0 | $0 |
| 2022 | $4,218 | $283,335 | $0 | $0 |
| 2021 | $4,154 | $275,083 | $0 | $0 |
| 2020 | $3,971 | $271,285 | $80,000 | $191,285 |
| 2019 | $4,102 | $266,009 | $0 | $0 |
| 2018 | $4,011 | $261,049 | $70,000 | $191,049 |
| 2017 | $3,983 | $257,634 | $70,000 | $187,634 |
| 2016 | $2,592 | $256,343 | $74,000 | $182,343 |
| 2015 | $2,633 | $213,607 | $74,000 | $139,607 |
| 2014 | $2,681 | $187,199 | $72,000 | $115,199 |
Source: Public Records
Map
Nearby Homes
- 7524 Quail Run Ct
- 5050 Hidden Springs Blvd
- 5056 Caspian Ct
- 7775 Conroy Windermere Rd
- 5224 Abelia Dr
- 4500 S Hiawassee Rd
- 7828 Snowberry Cir
- 4433 Winderwood Cir
- 4627 Woodlot Ct
- 7938 Tumblestone Dr
- 7407 Park Springs Cir
- 7289 Lake Floy Cir
- 7117 Wooded Village Ln
- 5442 Split Pine Ct
- 5607 Spring Run Ave
- 5109 Vistamere Ct
- 7023 Talbot Dr
- 4216 Winderlakes Dr
- 7905 Chad Ct
- 5325 Glasgow Ave
- 4942 Hidden Springs Blvd
- 4951 Caspian Ct
- 5002 Hidden Springs Blvd
- 4939 Caspian Ct
- 4953 Hidden Springs Blvd Unit 1
- 4930 Hidden Springs Blvd
- 5007 Caspian Ct
- 4941 Hidden Springs Blvd
- 4927 Caspian Ct
- 5001 Hidden Springs Blvd
- 5001 Hidden Springs Blvd Unit 1
- 5014 Hidden Springs Blvd
- 4929 Hidden Springs Blvd
- 5019 Caspian Ct
- 4918 Hidden Springs Blvd Unit 1
- 4918 Hidden Springs Blvd
- 4948 Spring Run Ave
- 4948 Spring Run Ave Unit 1
- 4952 Caspian Ct
- 5013 Hidden Springs Blvd