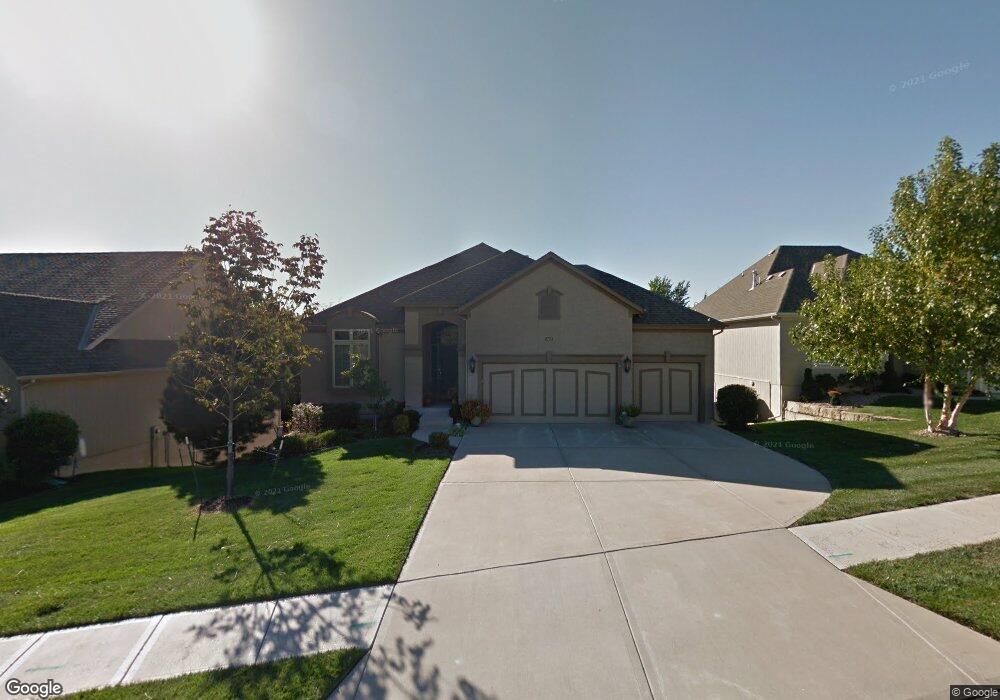
4956 Bradshaw St Shawnee, KS 66216
Estimated Value: $542,000 - $614,000
4
Beds
3
Baths
1,951
Sq Ft
$301/Sq Ft
Est. Value
About This Home
This home is located at 4956 Bradshaw St, Shawnee, KS 66216 and is currently estimated at $587,374, approximately $301 per square foot. 4956 Bradshaw St is a home located in Johnson County with nearby schools including Ray Marsh Elementary School, Trailridge Middle School, and Shawnee Mission Northwest High School.
Ownership History
Date
Name
Owned For
Owner Type
Purchase Details
Closed on
Sep 22, 2008
Sold by
Jff Pashman Construction Inc
Bought by
Howard Billy J and Howard Darlene G
Current Estimated Value
Home Financials for this Owner
Home Financials are based on the most recent Mortgage that was taken out on this home.
Original Mortgage
$75,500
Interest Rate
6.05%
Mortgage Type
New Conventional
Purchase Details
Closed on
Feb 28, 2006
Sold by
Heatherglen Partners Llc
Bought by
Jf Pashman Construction Inc
Home Financials for this Owner
Home Financials are based on the most recent Mortgage that was taken out on this home.
Original Mortgage
$358,000
Interest Rate
6.05%
Mortgage Type
Future Advance Clause Open End Mortgage
Purchase Details
Closed on
Dec 29, 2005
Sold by
Pflumm 51 Investors Llc
Bought by
Moffitt Development Co Inc
Create a Home Valuation Report for This Property
The Home Valuation Report is an in-depth analysis detailing your home's value as well as a comparison with similar homes in the area
Home Values in the Area
Average Home Value in this Area
Purchase History
| Date | Buyer | Sale Price | Title Company |
|---|---|---|---|
| Howard Billy J | -- | First American Title Insuran | |
| Jf Pashman Construction Inc | -- | Cbkc Title & Escrow Llc | |
| Moffitt Development Co Inc | -- | First American Title Insuran |
Source: Public Records
Mortgage History
| Date | Status | Borrower | Loan Amount |
|---|---|---|---|
| Closed | Howard Billy J | $75,500 | |
| Previous Owner | Jf Pashman Construction Inc | $358,000 |
Source: Public Records
Tax History Compared to Growth
Tax History
| Year | Tax Paid | Tax Assessment Tax Assessment Total Assessment is a certain percentage of the fair market value that is determined by local assessors to be the total taxable value of land and additions on the property. | Land | Improvement |
|---|---|---|---|---|
| 2024 | $6,922 | $64,826 | $11,689 | $53,137 |
| 2023 | $6,834 | $63,584 | $11,130 | $52,454 |
| 2022 | $6,729 | $62,399 | $11,130 | $51,269 |
| 2021 | $6,109 | $53,429 | $10,111 | $43,318 |
| 2020 | $6,100 | $52,659 | $10,111 | $42,548 |
| 2019 | $5,935 | $51,210 | $9,189 | $42,021 |
| 2018 | $5,875 | $50,497 | $9,189 | $41,308 |
| 2017 | $5,771 | $48,841 | $8,394 | $40,447 |
| 2016 | $5,991 | $50,071 | $8,394 | $41,677 |
| 2015 | $5,528 | $47,679 | $8,394 | $39,285 |
| 2013 | -- | $45,528 | $7,630 | $37,898 |
Source: Public Records
Map
Nearby Homes
- 5013 Bradshaw St
- 5021 Bradshaw St
- 13305 W 51st St
- 5300 Summit Ct
- 13130 W 52nd Terrace
- 13126 W 52nd Terrace
- 13134 W 52nd Terrace
- 13810 W 53rd St
- 14105 W 48th Terrace
- 5507 Noland Rd
- 12023 W 48th St
- 14210 W 50th St
- 11907 W 49th Place
- 5504 Monrovia St
- 13804 W 55th Terrace
- 5407 Halsey St
- W 48th St
- 12508 W 56th St
- 11815 W 53rd St
- 5530 Rene St
- 4952 Bradshaw St
- 4960 Bradshaw St
- 5002 Bradshaw St
- 4948 Bradshaw St
- 4955 Bradshaw St
- 5006 Bradshaw St
- 4951 Bradshaw St
- 12820 W 50th St
- 5010 Bradshaw St
- 5005 Bradshaw St
- 4940 Bradshaw St
- 12815 W 49th Terrace
- 12819 W 49th Terrace
- 5014 Bradshaw St
- 12823 W 49th Terrace
- 12810 W 50th St
- 4951 Noland Rd
- 12819 W 50th St
- 4936 Bradshaw St
- 4955 Noland Rd