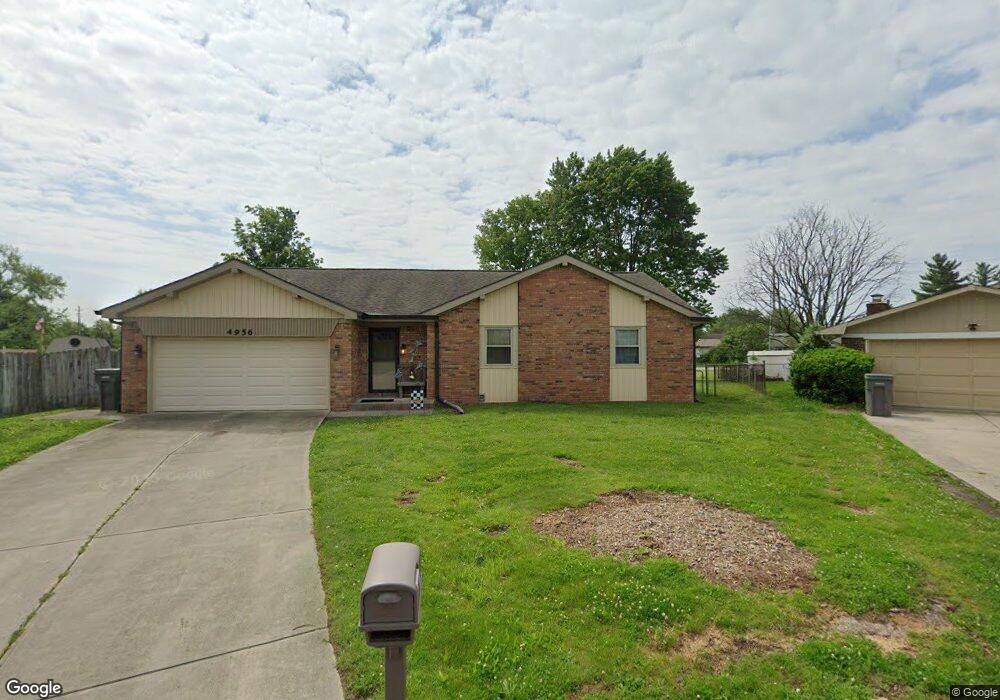
4956 Royal Orbit Ct Indianapolis, IN 46237
South Emerson NeighborhoodEstimated Value: $224,000 - $239,000
3
Beds
2
Baths
1,421
Sq Ft
$163/Sq Ft
Est. Value
About This Home
This home is located at 4956 Royal Orbit Ct, Indianapolis, IN 46237 and is currently estimated at $232,084, approximately $163 per square foot. 4956 Royal Orbit Ct is a home located in Marion County with nearby schools including Franklin Central High School, Gray Road Christian School, and Indianapolis Southside Christian Academy.
Ownership History
Date
Name
Owned For
Owner Type
Purchase Details
Closed on
Apr 19, 2006
Sold by
Johnson Dennis W and Johnson Amber G
Bought by
Buening Janice M
Current Estimated Value
Home Financials for this Owner
Home Financials are based on the most recent Mortgage that was taken out on this home.
Original Mortgage
$88,800
Outstanding Balance
$49,954
Interest Rate
6.48%
Mortgage Type
New Conventional
Estimated Equity
$182,130
Create a Home Valuation Report for This Property
The Home Valuation Report is an in-depth analysis detailing your home's value as well as a comparison with similar homes in the area
Home Values in the Area
Average Home Value in this Area
Purchase History
| Date | Buyer | Sale Price | Title Company |
|---|---|---|---|
| Buening Janice M | -- | None Available |
Source: Public Records
Mortgage History
| Date | Status | Borrower | Loan Amount |
|---|---|---|---|
| Open | Buening Janice M | $88,800 |
Source: Public Records
Tax History
| Year | Tax Paid | Tax Assessment Tax Assessment Total Assessment is a certain percentage of the fair market value that is determined by local assessors to be the total taxable value of land and additions on the property. | Land | Improvement |
|---|---|---|---|---|
| 2025 | $1,874 | $202,100 | $32,700 | $169,400 |
| 2024 | $1,884 | $187,400 | $32,700 | $154,700 |
| 2023 | $1,884 | $179,300 | $32,700 | $146,600 |
| 2022 | $1,818 | $172,900 | $32,700 | $140,200 |
| 2021 | $1,517 | $142,900 | $32,700 | $110,200 |
| 2020 | $1,466 | $138,000 | $32,700 | $105,300 |
| 2019 | $1,331 | $123,800 | $24,300 | $99,500 |
| 2018 | $1,267 | $117,600 | $24,300 | $93,300 |
| 2017 | $1,226 | $113,900 | $24,300 | $89,600 |
| 2016 | $1,183 | $109,600 | $24,300 | $85,300 |
| 2014 | $1,024 | $101,400 | $24,300 | $77,100 |
| 2013 | $945 | $96,000 | $24,300 | $71,700 |
Source: Public Records
Map
Nearby Homes
- 4945 Royal Orbit Ct
- 4921 Candy Spots Dr
- 4930 Candy Spots Dr
- 5120 Pappas Dr
- 5118 Gringo Dr
- 5147 Antigua Trail
- 5551 Personality Ct
- 4829 Dancer Dr
- 5135 Brouse Ct
- 5858 Timber Lake Blvd
- 5102 Triple Crown Way
- 5106 Triple Crown Way
- 5110 Triple Crown Way
- 5103 Triple Crown Way
- 5474 Sleet Dr
- 5146 Triple Crown Way
- 5111 Triple Crown Way
- 5115 Triple Crown Way
- 5107 Triple Crown Way
- 6044 Medina Spirit Dr
- 4946 Royal Orbit Ct
- 4952 Candy Spots Ct
- 4935 Royal Orbit Ct
- 4942 Candy Spots Ct
- 4936 Royal Orbit Ct
- 5610 Ensenada Ave
- 5618 Ensenada Ave
- 5606 Ensenada Ave
- 4926 Royal Orbit Ct
- 5622 Ensenada Ave
- 4962 Candy Spots Ct
- 5602 Ensenada Ave
- 5626 Ensenada Ave
- 4922 Candy Spots Ct
- 4937 Candy Spots Dr
- 5630 Ensenada Ave
- 4931 Candy Spots Dr
- 4925 Candy Spots Dr
- 4953 Candy Spots Ct
Your Personal Tour Guide
Ask me questions while you tour the home.