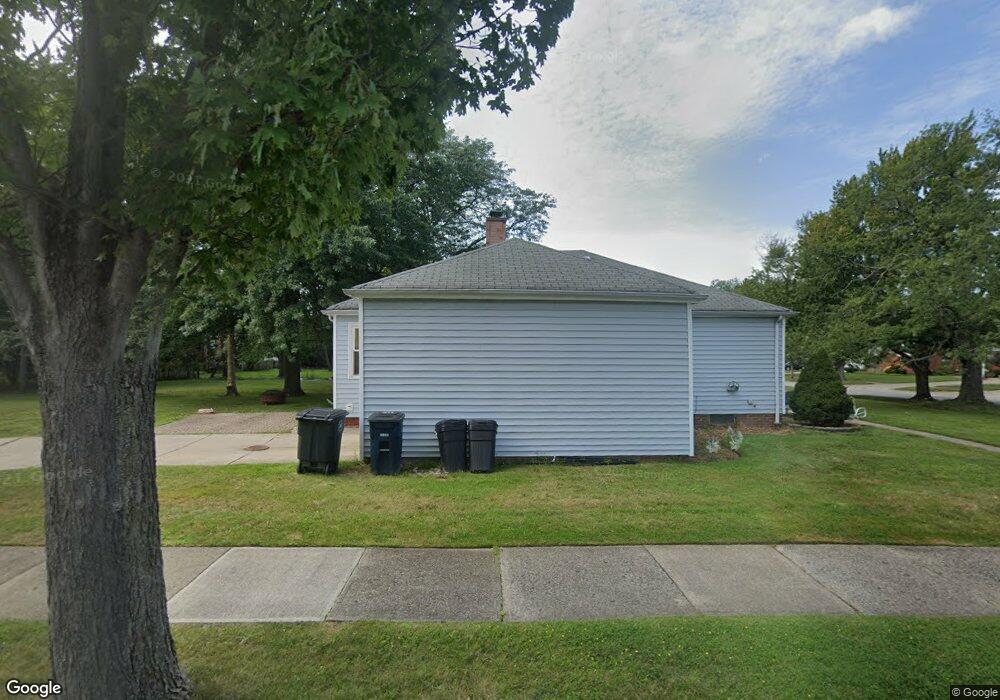
4956 S Sedgewick Rd Cleveland, OH 44124
Estimated Value: $196,170 - $242,000
3
Beds
2
Baths
1,200
Sq Ft
$187/Sq Ft
Est. Value
About This Home
This home is located at 4956 S Sedgewick Rd, Cleveland, OH 44124 and is currently estimated at $224,043, approximately $186 per square foot. 4956 S Sedgewick Rd is a home located in Cuyahoga County with nearby schools including Greenview Upper Elementary School, Sunview Elementary School, and Memorial Junior High School.
Ownership History
Date
Name
Owned For
Owner Type
Purchase Details
Closed on
Apr 22, 2013
Sold by
Aiello Frank C
Bought by
Aiello Lisa
Current Estimated Value
Home Financials for this Owner
Home Financials are based on the most recent Mortgage that was taken out on this home.
Original Mortgage
$92,500
Outstanding Balance
$65,204
Interest Rate
3.44%
Mortgage Type
Adjustable Rate Mortgage/ARM
Estimated Equity
$158,839
Purchase Details
Closed on
Oct 15, 1998
Sold by
Yang Huang and Tsai Huang Li Yun
Bought by
Aiello Frank and Aiello Lisa
Home Financials for this Owner
Home Financials are based on the most recent Mortgage that was taken out on this home.
Original Mortgage
$90,000
Interest Rate
6.78%
Purchase Details
Closed on
Aug 16, 1990
Sold by
Clough Jeanne C
Bought by
Huang Te-Yang
Purchase Details
Closed on
Dec 22, 1982
Sold by
Clough Jeanne C and Clough Robt S
Bought by
Clough Jeanne C
Purchase Details
Closed on
Jan 1, 1975
Bought by
Clough Jeanne C and Clough Robt S
Create a Home Valuation Report for This Property
The Home Valuation Report is an in-depth analysis detailing your home's value as well as a comparison with similar homes in the area
Home Values in the Area
Average Home Value in this Area
Purchase History
| Date | Buyer | Sale Price | Title Company |
|---|---|---|---|
| Aiello Lisa | -- | Third Capital Title | |
| Aiello Lisa | -- | Attorney | |
| Aiello Frank | $110,000 | Action Title Agency Inc | |
| Huang Te-Yang | $91,000 | -- | |
| Clough Jeanne C | -- | -- | |
| Clough Jeanne C | -- | -- |
Source: Public Records
Mortgage History
| Date | Status | Borrower | Loan Amount |
|---|---|---|---|
| Open | Aiello Lisa | $92,500 | |
| Closed | Aiello Frank | $90,000 |
Source: Public Records
Tax History Compared to Growth
Tax History
| Year | Tax Paid | Tax Assessment Tax Assessment Total Assessment is a certain percentage of the fair market value that is determined by local assessors to be the total taxable value of land and additions on the property. | Land | Improvement |
|---|---|---|---|---|
| 2024 | $4,171 | $59,115 | $13,790 | $45,325 |
| 2023 | $4,456 | $51,180 | $11,520 | $39,660 |
| 2022 | $4,430 | $51,170 | $11,520 | $39,660 |
| 2021 | $4,392 | $51,170 | $11,520 | $39,660 |
| 2020 | $4,121 | $41,970 | $9,450 | $32,520 |
| 2019 | $3,717 | $119,900 | $27,000 | $92,900 |
| 2018 | $3,828 | $41,970 | $9,450 | $32,520 |
| 2017 | $3,761 | $39,240 | $8,610 | $30,630 |
| 2016 | $3,730 | $39,240 | $8,610 | $30,630 |
| 2015 | $3,776 | $39,240 | $8,610 | $30,630 |
| 2014 | $3,776 | $40,050 | $8,790 | $31,260 |
Source: Public Records
Map
Nearby Homes
- 1333 Clearview Rd
- 4866 Fairlawn Rd
- 5103 Eastover Rd
- 4800 Farnhurst Rd
- 4781 Dorshwood Rd
- 1271 Dorsh Rd
- 4769 Edenwood Rd
- 5227 E Farnhurst Rd
- 981 Hanley Rd
- 5268 Edenhurst Rd
- 4669 Liberty Rd
- 1512 Parkside Cir
- 4650 Liberty Rd
- 4880 Anderson Rd
- 5079 Haverford Dr
- 4695 Mayfield Rd Unit A
- 5027 Bristol Ct
- 4685 Mayfield Rd Unit F
- 5144 Oakmont Dr
- 888 Richmond Rd
- 4952 S Sedgewick Rd
- 4968 S Sedgewick Rd
- 4942 S Sedgewick Rd
- 4951 Edsal Dr
- 4947 Edsal Dr
- 4972 S Sedgewick Rd
- 4938 S Sedgewick Rd
- 4967 Edsal Dr
- 4939 Edsal Dr
- 4971 Edsal Dr
- 4976 S Sedgewick Rd
- 4955 S Sedgewick Rd
- 4935 Edsal Dr
- 4951 S Sedgewick Rd
- 4975 Edsal Dr
- 4941 S Sedgewick Rd
- 4967 S Sedgewick Rd
- 4931 Edsal Dr
- 4984 S Sedgewick Rd
- 4928 S Sedgewick Rd