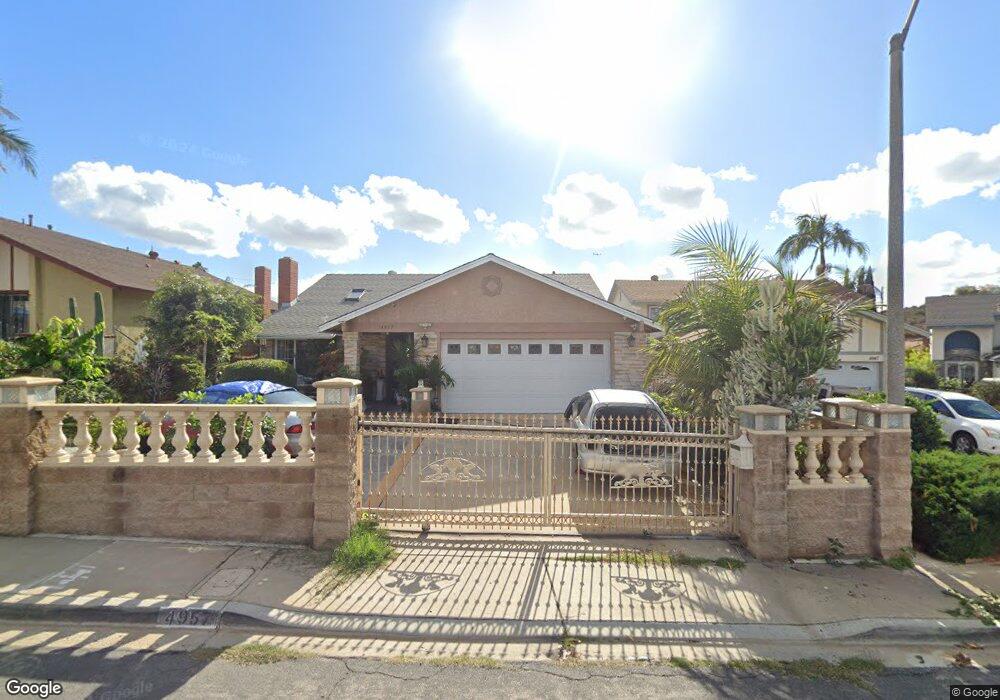
4957 Euclid Ct San Diego, CA 92105
Ridgeview-Webster NeighborhoodEstimated Value: $699,084 - $819,000
4
Beds
2
Baths
1,532
Sq Ft
$482/Sq Ft
Est. Value
About This Home
This home is located at 4957 Euclid Ct, San Diego, CA 92105 and is currently estimated at $738,771, approximately $482 per square foot. 4957 Euclid Ct is a home located in San Diego County with nearby schools including Oak Park Elementary School, Mann Middle School, and Crawford High School.
Ownership History
Date
Name
Owned For
Owner Type
Purchase Details
Closed on
Aug 28, 2025
Sold by
Ho Kevin Hung and Tran Trang Phuong
Bought by
Kevin Hung Ho & Trang Phuong Huu Tran Living and Ho
Current Estimated Value
Purchase Details
Closed on
Jan 26, 2020
Sold by
Tran Nguyen Quang
Bought by
Tran Trang Phuong Huu and Ho Kevin Hung
Purchase Details
Closed on
Feb 21, 2002
Sold by
Nguyen Linh Thi Bich
Bought by
Tran Nguyen Quang
Home Financials for this Owner
Home Financials are based on the most recent Mortgage that was taken out on this home.
Original Mortgage
$100,000
Interest Rate
6.57%
Purchase Details
Closed on
Jul 29, 1997
Sold by
Hood Family Trust 01-09-96 and Timothy E
Bought by
Tran Nguyen Quang
Home Financials for this Owner
Home Financials are based on the most recent Mortgage that was taken out on this home.
Original Mortgage
$115,200
Interest Rate
7.42%
Create a Home Valuation Report for This Property
The Home Valuation Report is an in-depth analysis detailing your home's value as well as a comparison with similar homes in the area
Home Values in the Area
Average Home Value in this Area
Purchase History
| Date | Buyer | Sale Price | Title Company |
|---|---|---|---|
| Kevin Hung Ho & Trang Phuong Huu Tran Living | -- | None Listed On Document | |
| Tran Trang Phuong Huu | -- | None Available | |
| Tran Nguyen Quang | -- | Fidelity National Title | |
| Tran Nguyen Quang | $144,000 | First American Title Co |
Source: Public Records
Mortgage History
| Date | Status | Borrower | Loan Amount |
|---|---|---|---|
| Previous Owner | Tran Nguyen Quang | $100,000 | |
| Previous Owner | Tran Nguyen Quang | $115,200 |
Source: Public Records
Tax History Compared to Growth
Tax History
| Year | Tax Paid | Tax Assessment Tax Assessment Total Assessment is a certain percentage of the fair market value that is determined by local assessors to be the total taxable value of land and additions on the property. | Land | Improvement |
|---|---|---|---|---|
| 2025 | $2,803 | $229,897 | $54,437 | $175,460 |
| 2024 | $2,803 | $225,390 | $53,370 | $172,020 |
| 2023 | $2,741 | $220,972 | $52,324 | $168,648 |
| 2022 | $2,668 | $216,641 | $51,299 | $165,342 |
| 2021 | $2,650 | $212,394 | $50,294 | $162,100 |
| 2020 | $2,618 | $210,217 | $49,779 | $160,438 |
| 2019 | $2,572 | $206,096 | $48,803 | $157,293 |
| 2018 | $2,406 | $202,056 | $47,847 | $154,209 |
| 2017 | $2,349 | $198,095 | $46,909 | $151,186 |
| 2016 | $2,310 | $194,212 | $45,990 | $148,222 |
| 2015 | $2,276 | $191,296 | $45,300 | $145,996 |
| 2014 | $2,242 | $187,550 | $44,413 | $143,137 |
Source: Public Records
Map
Nearby Homes
- 1951 47th St Unit 53
- 1951 47th St Unit 118
- 1951 47th St Unit 69
- 4666 Home Ave Unit 68
- 2872 47th St
- 4712 Home Ave
- 2641 46th St
- 2503 2501 Sumac Dr
- 0 Redwood St Unit IG25200939
- 5251 Laurel St
- 4455 Home Ave Unit 2
- 2549 Roseview Place
- 2568 Roseview Place
- 2621 Highland Ave
- 3024 46th St
- 3015 Chamoune Ave
- 5359 Caminito Mindy
- 4769 Thorn St
- 4975 Loris St
- 1675 Pentecost Way Unit 3