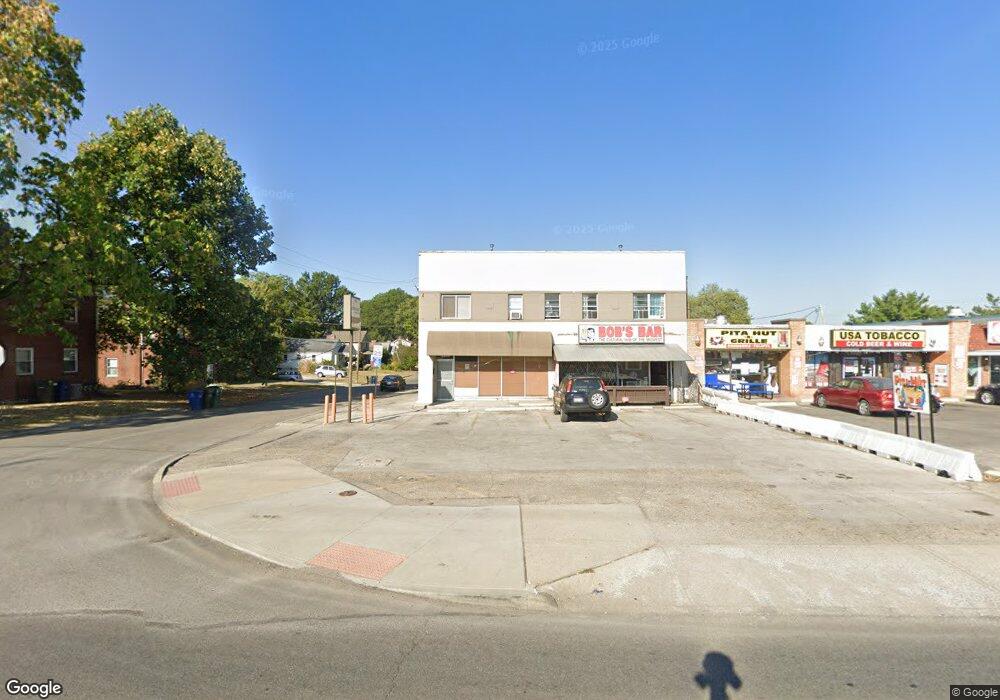
4959 N High St Columbus, OH 43214
Clintonville NeighborhoodEstimated Value: $963,856
--
Bed
--
Bath
6,752
Sq Ft
$143/Sq Ft
Est. Value
About This Home
This home is located at 4959 N High St, Columbus, OH 43214 and is currently estimated at $963,856, approximately $142 per square foot. 4959 N High St is a home located in Franklin County with nearby schools including Indian Springs Elementary School, Dominion Middle School, and Whetstone High School.
Ownership History
Date
Name
Owned For
Owner Type
Purchase Details
Closed on
Jul 1, 2013
Sold by
Strangas Family Properties Llc
Bought by
Bobs Bar 2 Llc
Current Estimated Value
Home Financials for this Owner
Home Financials are based on the most recent Mortgage that was taken out on this home.
Original Mortgage
$337,500
Outstanding Balance
$244,476
Interest Rate
3.83%
Mortgage Type
Commercial
Estimated Equity
$719,380
Purchase Details
Closed on
Mar 4, 2004
Sold by
Strangas Peter M and Strangas Vikki P
Bought by
Strangas Family Properties Llc
Purchase Details
Closed on
Jan 26, 1984
Bought by
Strangas Peter M
Create a Home Valuation Report for This Property
The Home Valuation Report is an in-depth analysis detailing your home's value as well as a comparison with similar homes in the area
Home Values in the Area
Average Home Value in this Area
Purchase History
| Date | Buyer | Sale Price | Title Company |
|---|---|---|---|
| Bobs Bar 2 Llc | $375,000 | None Available | |
| Strangas Family Properties Llc | -- | -- | |
| Strangas Peter M | $125,000 | -- |
Source: Public Records
Mortgage History
| Date | Status | Borrower | Loan Amount |
|---|---|---|---|
| Open | Bobs Bar 2 Llc | $337,500 |
Source: Public Records
Tax History Compared to Growth
Tax History
| Year | Tax Paid | Tax Assessment Tax Assessment Total Assessment is a certain percentage of the fair market value that is determined by local assessors to be the total taxable value of land and additions on the property. | Land | Improvement |
|---|---|---|---|---|
| 2024 | $13,223 | $178,160 | $37,840 | $140,320 |
| 2023 | $13,014 | $178,150 | $37,835 | $140,315 |
| 2022 | $15,527 | $137,830 | $27,720 | $110,110 |
| 2021 | $10,381 | $137,830 | $27,720 | $110,110 |
| 2020 | $10,309 | $137,830 | $27,720 | $110,110 |
| 2019 | $10,320 | $125,300 | $25,200 | $100,100 |
| 2018 | $10,446 | $125,300 | $25,200 | $100,100 |
| 2017 | $10,890 | $125,300 | $25,200 | $100,100 |
| 2016 | $11,472 | $131,250 | $25,200 | $106,050 |
| 2015 | $10,605 | $131,250 | $25,200 | $106,050 |
| 2014 | $8,197 | $131,250 | $25,200 | $106,050 |
| 2013 | $4,062 | $101,500 | $25,200 | $76,300 |
Source: Public Records
Map
Nearby Homes
- 116 Rathbone Ave
- 4 W Royal Forest Blvd
- 202 Rathbone Ave
- 253 Fenway Rd
- 4994 Delawanda Ave
- 5200 Fenway Ct Unit A
- 270 Westview Ave
- 33 Rosslyn Ave
- 5255 Fenway Place Unit D
- 87 Charleston Ave
- 252 W Kanawha Ave
- 125 Sheffield Rd
- 409 Fenway Rd
- 381 E Jeffrey Place
- 156 E Weisheimer Rd
- 131 Broad Meadows Blvd
- 255 Garden Rd
- 420 E Beechwold Blvd
- 162 Broad Meadows Blvd
- 5508 Emerson Ave
- 4967 N High St Unit 2
- 4967 N High St
- 4971 N High St
- 4945 N High St Unit 51
- 28 Leland Ave
- 34 Leland Ave
- 31 Leland Ave
- 40 Leland Ave
- 39 Leland Ave
- 5019 N High St Unit 82
- 5019 N High St Unit 74
- 5019 N High St
- 5019 N High St Unit 103
- 5019 N High St Unit 49
- 46 Leland Ave
- 4939 N High St
- 47 Leland Ave
- 52 Leland Ave
- 34 W Rathbone Ave
- 51 Leland Ave