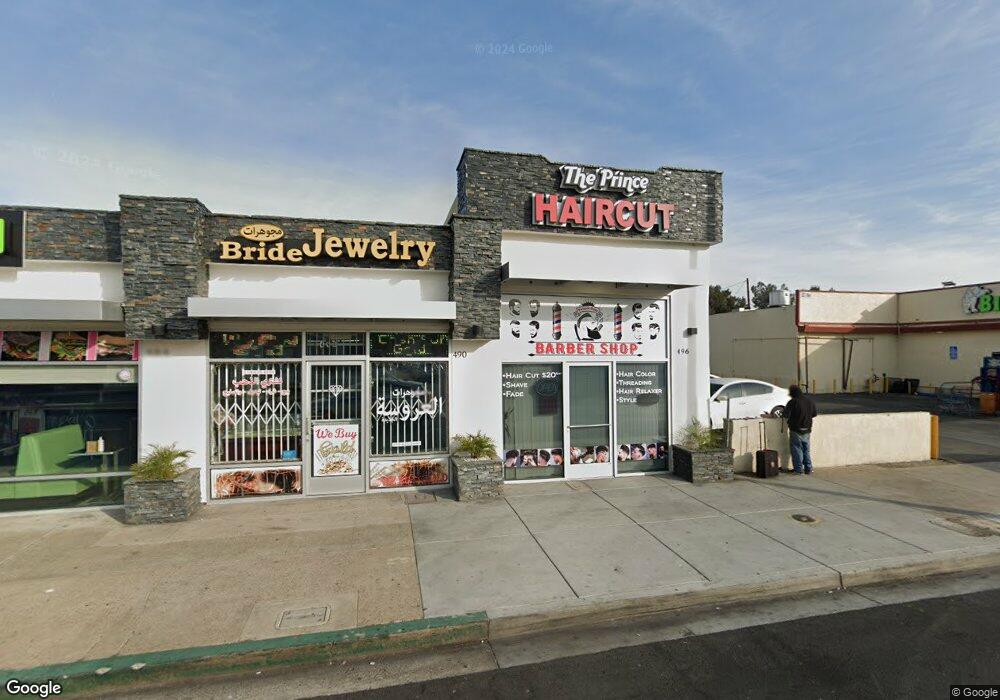
496 E Main St El Cajon, CA 92020
Studio
--
Bath
2,346
Sq Ft
871
Sq Ft Lot
About This Home
This home is located at 496 E Main St, El Cajon, CA 92020. 496 E Main St is a home located in San Diego County with nearby schools including Naranca Elementary School, Cajon Valley Middle School, and El Cajon Valley High School.
Ownership History
Date
Name
Owned For
Owner Type
Purchase Details
Closed on
Jan 15, 2019
Sold by
Savio & Stavro Inc
Bought by
Liberty Investments Llc
Home Financials for this Owner
Home Financials are based on the most recent Mortgage that was taken out on this home.
Original Mortgage
$950,000
Outstanding Balance
$341,666
Interest Rate
4.7%
Mortgage Type
Balloon
Purchase Details
Closed on
Aug 26, 2015
Sold by
Karavantes Properties Llc
Bought by
Savio & Stavro Inc
Home Financials for this Owner
Home Financials are based on the most recent Mortgage that was taken out on this home.
Original Mortgage
$300,000
Interest Rate
3.85%
Mortgage Type
Commercial
Purchase Details
Closed on
Nov 12, 2010
Sold by
Salamy Connie Ann
Bought by
Karavantes Properties Llc
Purchase Details
Closed on
Mar 18, 2005
Sold by
Karavantes Ann S
Bought by
Karavantes Ann S
Purchase Details
Closed on
Mar 17, 2005
Sold by
Karavantes Ann S
Bought by
Karavantes Ann S
Purchase Details
Closed on
Mar 30, 1984
Purchase Details
Closed on
Nov 3, 1983
Create a Home Valuation Report for This Property
The Home Valuation Report is an in-depth analysis detailing your home's value as well as a comparison with similar homes in the area
Purchase History
| Date | Buyer | Sale Price | Title Company |
|---|---|---|---|
| Liberty Investments Llc | -- | Chicago Title Company | |
| Savio & Stavro Inc | $1,000,000 | First American Title | |
| Karavantes Properties Llc | -- | None Available | |
| Karavantes Properties Llc | -- | None Available | |
| Karavantes Ann S | -- | -- | |
| Karavantes Ann S | -- | -- | |
| -- | $140,000 | -- | |
| -- | $115,000 | -- |
Source: Public Records
Mortgage History
| Date | Status | Borrower | Loan Amount |
|---|---|---|---|
| Open | Liberty Investments Llc | $950,000 | |
| Previous Owner | Savio & Stavro Inc | $300,000 |
Source: Public Records
Tax History
| Year | Tax Paid | Tax Assessment Tax Assessment Total Assessment is a certain percentage of the fair market value that is determined by local assessors to be the total taxable value of land and additions on the property. | Land | Improvement |
|---|---|---|---|---|
| 2025 | $11,269 | $763,542 | $355,136 | $408,406 |
| 2024 | $11,269 | $748,572 | $348,173 | $400,399 |
| 2023 | $11,340 | $733,896 | $341,347 | $392,549 |
| 2022 | $10,522 | $719,506 | $334,654 | $384,852 |
| 2021 | $10,230 | $705,399 | $328,093 | $377,306 |
| 2020 | $10,260 | $698,167 | $324,729 | $373,438 |
| 2019 | $9,157 | $684,478 | $318,362 | $366,116 |
| 2018 | $9,023 | $671,058 | $312,120 | $358,938 |
| 2017 | $8,895 | $657,900 | $306,000 | $351,900 |
| 2016 | $8,573 | $645,000 | $300,000 | $345,000 |
| 2015 | $3,638 | $231,382 | $172,380 | $59,002 |
| 2014 | $3,583 | $226,851 | $169,004 | $57,847 |
Source: Public Records
Map
Nearby Homes
- 300 Roanoke Rd Unit 14
- 732 E Lexington Ave Unit 19
- 0 Rea Ave
- 373 Connecticut Ave
- 469 Taft Ave
- 459 Ballantyne St Unit 31
- 505 E Madison Ave Unit 70
- 489 S Lincoln Ave
- 477 S Lincoln Ave
- 527 Claydelle Ave
- 150 S Anza St Unit 69
- 390 E Madison Ave Unit H
- 390 E Madison Ave Unit E
- 988 E Main St Unit B
- 759 Lincoln Place
- 998 E Main St Unit 50
- 606 S Mollison Ave Unit A
- 549 Marble St
- 438 S Anza St
- 480 S Anza St
- 502 E Main St
- 151 Ballantyne St
- 524 E Main St
- 518 E Main St
- 125 Ballantyne St
- 522 E Main St
- 550 E Main St
- 148 Taft Ave
- 163 Ballantyne St
- 120 Ballantyne St
- 120 Ballantyne St Unit Floor Plan 4
- 120 Ballantyne St Unit 5
- 120 Ballantyne St
- 120 Ballantyne St Unit E
- 120 Ballantyne St Unit 1
- 566 E Main St
- 181 Ballantyne St
- 562-566 562-566 E Main St
- 562 E Main St
- 130 Roanoke Rd
Your Personal Tour Guide
Ask me questions while you tour the home.