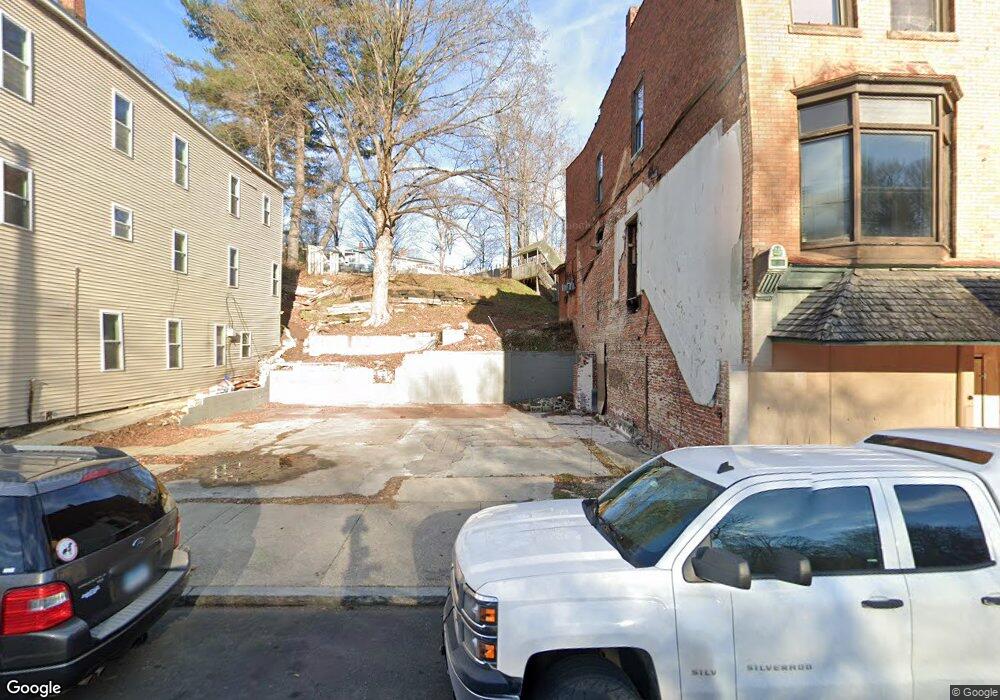
496 Main St Winsted, CT 06098
Estimated Value: $64,914
--
Bed
--
Bath
330
Sq Ft
$197/Sq Ft
Est. Value
About This Home
This home is located at 496 Main St, Winsted, CT 06098 and is currently estimated at $64,914, approximately $196 per square foot. 496 Main St is a home located in Litchfield County with nearby schools including Explorations Charter School.
Ownership History
Date
Name
Owned For
Owner Type
Purchase Details
Closed on
Nov 22, 2022
Sold by
Coppermine Properties Llc
Bought by
5 Elements Llc
Current Estimated Value
Purchase Details
Closed on
Apr 28, 2022
Sold by
Flint Asa
Bought by
Coppermine Properties Llc
Purchase Details
Closed on
Dec 20, 2018
Sold by
Winsted Diner Llc
Bought by
Flint Asa
Home Financials for this Owner
Home Financials are based on the most recent Mortgage that was taken out on this home.
Original Mortgage
$62,000
Interest Rate
4.9%
Mortgage Type
New Conventional
Purchase Details
Closed on
Jun 2, 2006
Sold by
Radocchio Robert A
Bought by
Winsted Diner Llc
Create a Home Valuation Report for This Property
The Home Valuation Report is an in-depth analysis detailing your home's value as well as a comparison with similar homes in the area
Home Values in the Area
Average Home Value in this Area
Purchase History
| Date | Buyer | Sale Price | Title Company |
|---|---|---|---|
| 5 Elements Llc | $50,000 | None Available | |
| 5 Elements Llc | $50,000 | None Available | |
| 5 Elements Llc | $50,000 | None Available | |
| Coppermine Properties Llc | $40,000 | None Available | |
| Coppermine Properties Llc | $40,000 | None Available | |
| Coppermine Properties Llc | $40,000 | None Available | |
| Flint Asa | $64,000 | -- | |
| Flint Asa | $64,000 | -- | |
| Flint Asa | $64,000 | -- | |
| Winsted Diner Llc | $39,000 | -- | |
| Winsted Diner Llc | $39,000 | -- |
Source: Public Records
Mortgage History
| Date | Status | Borrower | Loan Amount |
|---|---|---|---|
| Previous Owner | Flint Asa | $62,000 | |
| Previous Owner | Winsted Diner Llc | $25,000 |
Source: Public Records
Tax History Compared to Growth
Tax History
| Year | Tax Paid | Tax Assessment Tax Assessment Total Assessment is a certain percentage of the fair market value that is determined by local assessors to be the total taxable value of land and additions on the property. | Land | Improvement |
|---|---|---|---|---|
| 2025 | $1,603 | $54,950 | $26,530 | $28,420 |
| 2024 | $1,497 | $54,950 | $26,530 | $28,420 |
| 2023 | $1,450 | $54,950 | $26,530 | $28,420 |
| 2022 | $1,559 | $46,480 | $23,660 | $22,820 |
| 2021 | $1,559 | $46,480 | $23,660 | $22,820 |
| 2020 | $1,559 | $46,480 | $23,660 | $22,820 |
| 2019 | $1,559 | $46,480 | $23,660 | $22,820 |
| 2018 | $1,559 | $46,480 | $23,660 | $22,820 |
| 2017 | $1,690 | $50,400 | $33,810 | $16,590 |
| 2016 | $1,690 | $50,400 | $33,810 | $16,590 |
| 2015 | $1,648 | $50,400 | $33,810 | $16,590 |
| 2014 | $1,608 | $50,400 | $33,810 | $16,590 |
Source: Public Records
Map
Nearby Homes