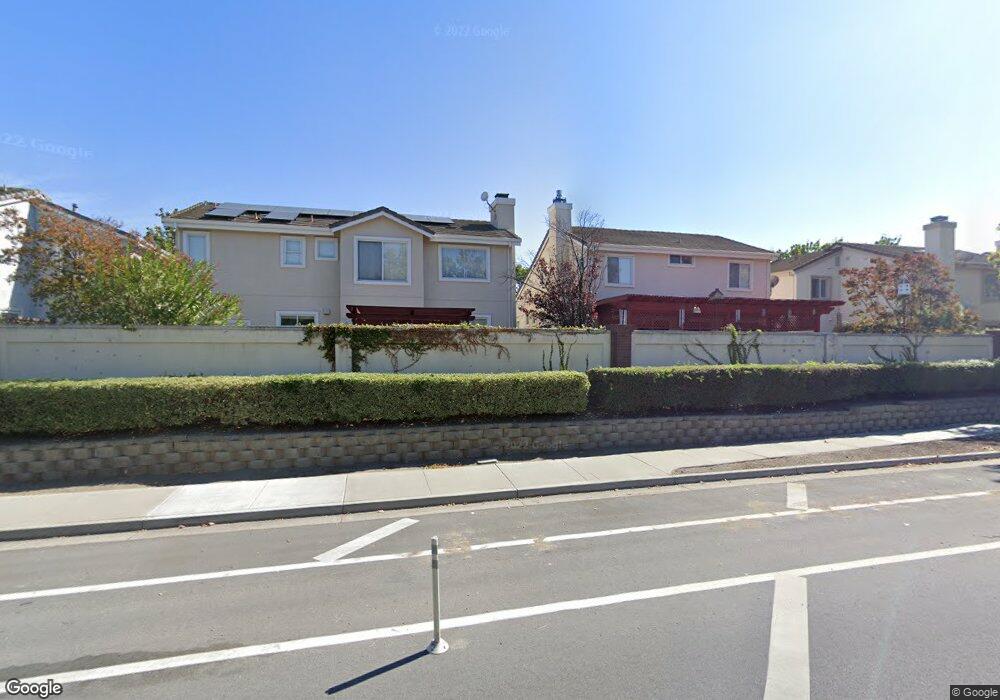
496 Stonefield Ct San Jose, CA 95136
South San Jose NeighborhoodEstimated Value: $1,561,000 - $1,774,000
4
Beds
3
Baths
1,853
Sq Ft
$884/Sq Ft
Est. Value
About This Home
This home is located at 496 Stonefield Ct, San Jose, CA 95136 and is currently estimated at $1,638,001, approximately $883 per square foot. 496 Stonefield Ct is a home located in Santa Clara County with nearby schools including George Shirakawa Sr. Elementary School, Sylvandale Middle School, and Andrew P. Hill High School.
Ownership History
Date
Name
Owned For
Owner Type
Purchase Details
Closed on
Oct 16, 2024
Sold by
Huynh Phoebe Phung Xuan
Bought by
Phoebe Huynh Revocable Trust and Huynh
Current Estimated Value
Purchase Details
Closed on
Sep 11, 2012
Sold by
Huynh Phoebe Phung Xuan and Huynh Jacky
Bought by
Huynh Phoebe Phung Xuan and Huynh Jacky
Home Financials for this Owner
Home Financials are based on the most recent Mortgage that was taken out on this home.
Original Mortgage
$320,000
Interest Rate
3.5%
Mortgage Type
New Conventional
Purchase Details
Closed on
Feb 11, 2010
Sold by
Huynh Phoebe Phung Xuan and Huynh Jacky
Bought by
Huynh Phoebe Phung Xuan and Huynh Jacky
Home Financials for this Owner
Home Financials are based on the most recent Mortgage that was taken out on this home.
Original Mortgage
$330,000
Interest Rate
4.97%
Mortgage Type
New Conventional
Purchase Details
Closed on
May 13, 2002
Sold by
Ly Huy and Ly Nga
Bought by
Huynh Jacky and Huynh Phoebe Phung Xuan
Purchase Details
Closed on
Jun 12, 1996
Sold by
Greystone Homes Inc
Bought by
Ly Huy and Ly Nga
Home Financials for this Owner
Home Financials are based on the most recent Mortgage that was taken out on this home.
Original Mortgage
$268,000
Interest Rate
7.62%
Create a Home Valuation Report for This Property
The Home Valuation Report is an in-depth analysis detailing your home's value as well as a comparison with similar homes in the area
Home Values in the Area
Average Home Value in this Area
Purchase History
| Date | Buyer | Sale Price | Title Company |
|---|---|---|---|
| Phoebe Huynh Revocable Trust | -- | None Listed On Document | |
| Huynh Phoebe Phung Xuan | $107,000 | Chicago Title Company | |
| Huynh Phoebe Phung Xuan | $110,000 | Chicago Title Company | |
| Huynh Jacky | -- | -- | |
| Ly Huy | $335,500 | First American Title Guarant |
Source: Public Records
Mortgage History
| Date | Status | Borrower | Loan Amount |
|---|---|---|---|
| Previous Owner | Huynh Phoebe Phung Xuan | $320,000 | |
| Previous Owner | Huynh Phoebe Phung Xuan | $330,000 | |
| Previous Owner | Ly Huy | $268,000 |
Source: Public Records
Tax History Compared to Growth
Tax History
| Year | Tax Paid | Tax Assessment Tax Assessment Total Assessment is a certain percentage of the fair market value that is determined by local assessors to be the total taxable value of land and additions on the property. | Land | Improvement |
|---|---|---|---|---|
| 2025 | $11,672 | $812,498 | $517,048 | $295,450 |
| 2024 | $11,672 | $796,567 | $506,910 | $289,657 |
| 2023 | $11,378 | $780,949 | $496,971 | $283,978 |
| 2022 | $11,378 | $765,637 | $487,227 | $278,410 |
| 2021 | $11,356 | $750,625 | $477,674 | $272,951 |
| 2020 | $11,016 | $742,930 | $472,777 | $270,153 |
| 2019 | $10,572 | $728,363 | $463,507 | $264,856 |
| 2018 | $10,576 | $714,082 | $454,419 | $259,663 |
| 2017 | $10,444 | $700,081 | $445,509 | $254,572 |
| 2016 | $9,930 | $686,355 | $436,774 | $249,581 |
| 2015 | $9,728 | $676,047 | $430,214 | $245,833 |
| 2014 | $9,220 | $662,805 | $421,787 | $241,018 |
Source: Public Records
Map
Nearby Homes
- 448 River Rock Ct
- 432 Curraghmore Ct
- 337 Ballymore Cir
- 349 Marble Arch Ave Unit 78
- 3337 Midtown Place
- 3315 Skyward Place
- 465 Tower Hill Ave
- 561 Manhattan Place Unit 20116
- 3077 Valley of Hearts Del Place Unit 6
- 3637 Snell Ave Unit 239
- 3637 Snell Ave Unit 174
- 3637 Snell Ave Unit 132
- 3637 Snell Ave Unit 156
- 3637 Snell Ave Unit 307
- 3637 Snell Ave Unit 61
- 223 William Manly St Unit 1
- 199 William Manly St Unit 3
- 193 William Manly St Unit 4
- 3940 Luneta Ct
- 3092 Manuel St Unit 1
- 488 Stonefield Ct
- 500 Stonefield Ct
- 469 Shadow Rock Ct
- 463 Shadow Rock Ct
- 475 Shadow Rock Ct
- 482 Stonefield Ct
- 495 Stonefield Ct
- 457 Shadow Rock Ct
- 489 Stonefield Ct
- 501 Stonefield Ct
- 476 Stonefield Ct
- 483 Stonefield Ct
- 3560 Quarry Park Dr
- 3548 Quarry Park Dr
- 3501 Quarry Park Dr
- 468 Shadow Rock Ct
- 477 Stonefield Ct
- 3495 Quarry Park Dr
- 3507 Quarry Park Dr
- 462 Shadow Rock Ct