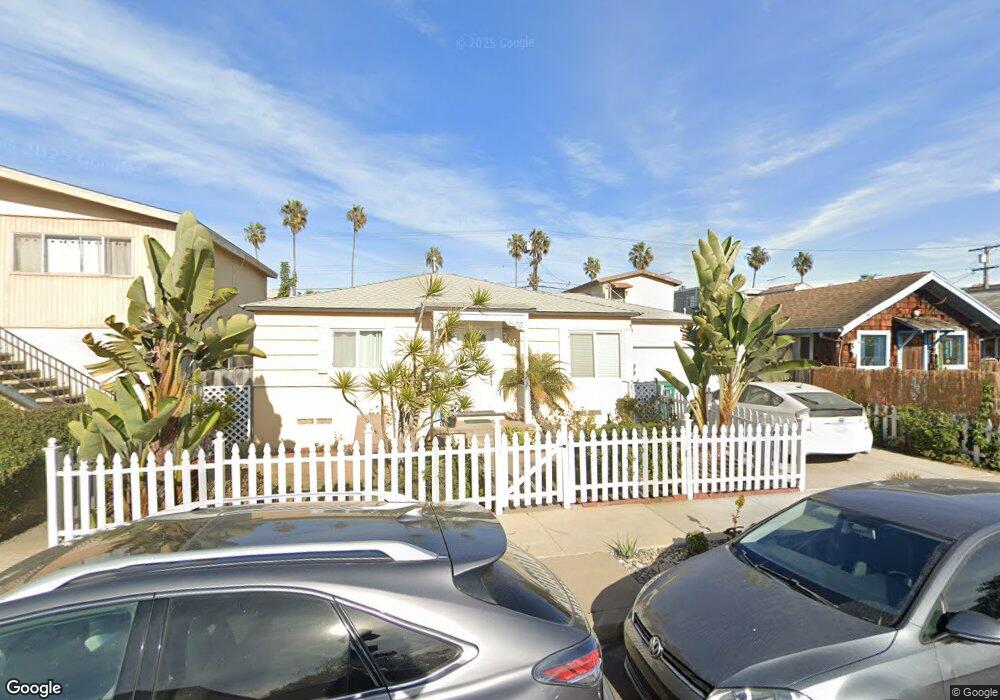
4960 Muir Ave San Diego, CA 92107
Ocean Beach NeighborhoodEstimated Value: $1,055,000 - $1,305,000
2
Beds
1
Bath
810
Sq Ft
$1,469/Sq Ft
Est. Value
About This Home
This home is located at 4960 Muir Ave, San Diego, CA 92107 and is currently estimated at $1,189,520, approximately $1,468 per square foot. 4960 Muir Ave is a home located in San Diego County with nearby schools including Ocean Beach Elementary School, Richard Henry Dana Middle School, and Correia Middle School.
Ownership History
Date
Name
Owned For
Owner Type
Purchase Details
Closed on
Jan 7, 2014
Sold by
Block Richard A and Dinsmore Block Janice
Bought by
Block Richard A and Dinsmore Block Janice
Current Estimated Value
Home Financials for this Owner
Home Financials are based on the most recent Mortgage that was taken out on this home.
Original Mortgage
$417,000
Interest Rate
4.26%
Mortgage Type
New Conventional
Purchase Details
Closed on
Nov 12, 2001
Sold by
Block Richard A and Dinsmore Block Janice
Bought by
Block Richard A and Dinsmore Block Janice
Home Financials for this Owner
Home Financials are based on the most recent Mortgage that was taken out on this home.
Original Mortgage
$200,000
Interest Rate
6.09%
Purchase Details
Closed on
Nov 5, 2001
Sold by
Block Richard A and Dinsmore Block Janice
Bought by
Block Richard A and Dinsmore Block Janice
Home Financials for this Owner
Home Financials are based on the most recent Mortgage that was taken out on this home.
Original Mortgage
$200,000
Interest Rate
6.09%
Create a Home Valuation Report for This Property
The Home Valuation Report is an in-depth analysis detailing your home's value as well as a comparison with similar homes in the area
Home Values in the Area
Average Home Value in this Area
Purchase History
| Date | Buyer | Sale Price | Title Company |
|---|---|---|---|
| Block Richard A | -- | Accommodation | |
| Block Richard A | -- | Ticor Title Company Of Calif | |
| Block Richard A | -- | Commonwealth Land Title Co | |
| Block Richard A | -- | Commonwealth Land Title Co |
Source: Public Records
Mortgage History
| Date | Status | Borrower | Loan Amount |
|---|---|---|---|
| Closed | Block Richard A | $417,000 | |
| Closed | Block Richard A | $200,000 |
Source: Public Records
Tax History Compared to Growth
Tax History
| Year | Tax Paid | Tax Assessment Tax Assessment Total Assessment is a certain percentage of the fair market value that is determined by local assessors to be the total taxable value of land and additions on the property. | Land | Improvement |
|---|---|---|---|---|
| 2025 | $1,080 | $86,808 | $52,184 | $34,624 |
| 2024 | $1,080 | $85,107 | $51,161 | $33,946 |
| 2023 | $1,056 | $83,439 | $50,158 | $33,281 |
| 2022 | $1,028 | $81,804 | $49,175 | $32,629 |
| 2021 | $1,021 | $80,201 | $48,211 | $31,990 |
| 2020 | $1,009 | $79,379 | $47,717 | $31,662 |
| 2019 | $992 | $77,824 | $46,782 | $31,042 |
| 2018 | $929 | $76,299 | $45,865 | $30,434 |
| 2017 | $80 | $74,804 | $44,966 | $29,838 |
| 2016 | $891 | $73,338 | $44,085 | $29,253 |
| 2015 | $878 | $72,237 | $43,423 | $28,814 |
| 2014 | $865 | $70,823 | $42,573 | $28,250 |
Source: Public Records
Map
Nearby Homes
- 4922 Muir Ave
- 5036 W Point Loma Blvd
- 5038-40 W Point Loma Blvd
- 4804 Cape May Ave
- 5123 Lotus St
- 5155 W Point Loma Blvd Unit 9
- 4685 Long Branch Ave
- 5152 Brighton Ave
- 4633-35 Lotus St
- 4725 Saratoga Ave
- 4674 Saratoga Ave Unit 2
- 4614 Larkspur St
- 4522 Brighton Ave
- 2068 Guizot St
- 1817-19 Sunset Cliffs Blvd
- 4985 Narragansett Ave Unit 87
- 4420 Voltaire St
- 4545 Newport Ave
- 4408 Brighton Ave
- 2632 Bayside Walk
- 4956 Muir Ave
- 4962 Muir Ave
- 4968 Muir Ave Unit 74
- 4948 Muir Ave Unit 54
- 4976 Muir Ave
- 4942 Muir Ave Unit 44
- 4978 Muir Ave
- 4959 Muir Ave
- 4955 Muir Ave
- 4965 Muir Ave
- 4945 Muir Ave
- 4969 Voltaire St
- 4979 Muir Ave
- 2163 Bacon St Unit 65
- 2167 Bacon St Unit 69
- 4937-39 Muir Ave
- 4937 Muir Ave
- 2175 Bacon St
- 2175 Bacon St Unit 77
- 4933 Voltaire St