4961 Eastside Rd Redding, CA 96001
Bonnyview NeighborhoodEstimated Value: $215,000 - $269,000
2
Beds
1
Bath
988
Sq Ft
$240/Sq Ft
Est. Value
About This Home
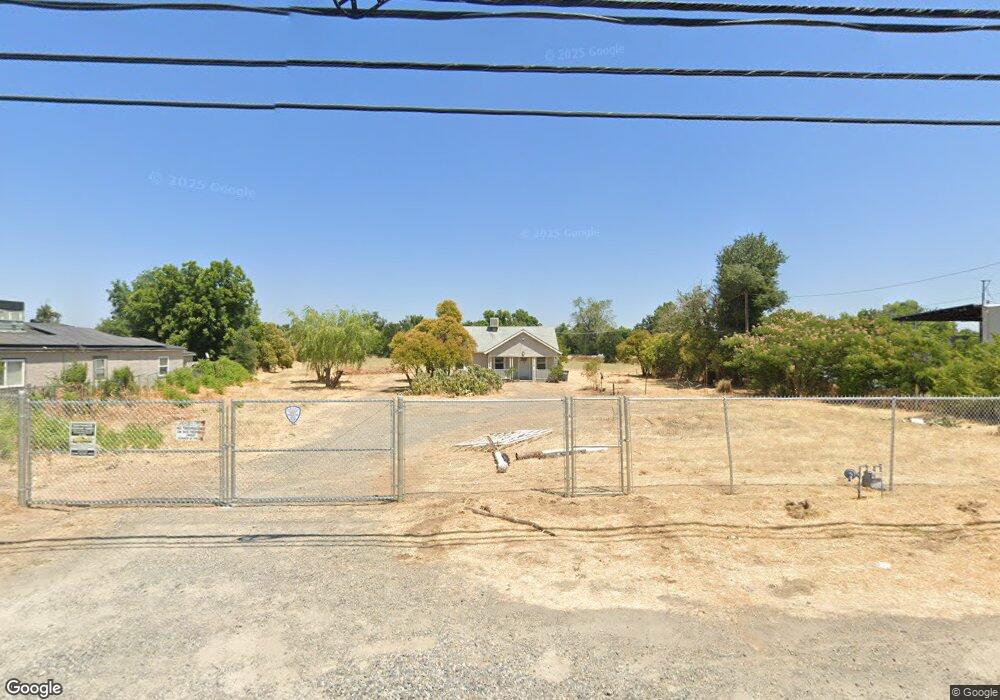
This home is located at 4961 Eastside Rd, Redding, CA 96001 and is currently estimated at $237,074, approximately $239 per square foot. 4961 Eastside Rd is a home located in Shasta County with nearby schools including Bonny View Elementary School, Sequoia Middle School, and Shasta High School.
Ownership History
Date
Name
Owned For
Owner Type
Purchase Details
Closed on
Nov 22, 2021
Sold by
Cook Jessica M
Bought by
Paggu Investments Llc
Current Estimated Value
Purchase Details
Closed on
Jan 25, 2018
Sold by
Cook Nedra M
Bought by
Cook Jessica M
Purchase Details
Closed on
Feb 27, 2007
Sold by
Cook Daniel G
Bought by
Cook Daniel George
Purchase Details
Closed on
Nov 14, 2006
Sold by
Cook Daniel George
Bought by
Cook Daniel George
Create a Home Valuation Report for This Property
The Home Valuation Report is an in-depth analysis detailing your home's value as well as a comparison with similar homes in the area
Home Values in the Area
Average Home Value in this Area
Purchase History
| Date | Buyer | Sale Price | Title Company |
|---|---|---|---|
| Paggu Investments Llc | $225,000 | Fidelity Natl Ttl Co Of Ca | |
| Cook Jessica M | -- | None Available | |
| Cook Daniel George | -- | None Available | |
| Cook Daniel George | -- | None Available | |
| Cook Daniel George | -- | None Available |
Source: Public Records
Tax History
| Year | Tax Paid | Tax Assessment Tax Assessment Total Assessment is a certain percentage of the fair market value that is determined by local assessors to be the total taxable value of land and additions on the property. | Land | Improvement |
|---|---|---|---|---|
| 2025 | $2,482 | $238,771 | $185,711 | $53,060 |
| 2024 | $2,445 | $234,090 | $182,070 | $52,020 |
| 2023 | $2,445 | $229,500 | $178,500 | $51,000 |
| 2022 | $2,403 | $225,000 | $175,000 | $50,000 |
| 2021 | $1,701 | $155,895 | $126,557 | $29,338 |
| 2020 | $1,723 | $154,298 | $125,260 | $29,038 |
| 2019 | $1,636 | $151,273 | $122,804 | $28,469 |
| 2018 | $1,651 | $148,308 | $120,397 | $27,911 |
| 2017 | $1,642 | $145,401 | $118,037 | $27,364 |
| 2016 | $1,590 | $142,551 | $115,723 | $26,828 |
| 2015 | $1,570 | $140,411 | $113,985 | $26,426 |
| 2014 | $1,559 | $137,662 | $111,753 | $25,909 |
Source: Public Records
Map
Nearby Homes
- 2340 Wilsey Dr
- 4920 Bonnyview Ave
- 2521 Radio Ln
- 4549 Harrison Ave
- 2230 El Reno Ln
- 4410 Westside Rd
- 0 Lot4 Unit 2 Ph 2 Stillwater Unit 25-4962
- 0 Lot3 Unit 2 Ph 2 Stillwater Unit 25-4961
- 0 Lot6 Unit 2 Ph 2 Stillwater Unit 25-4964
- 0 Lot5 Unit 2 Ph 2 Stillwater Unit 25-4963
- 0 Lot16 Unit 2 Ph 2 Stillwater Unit 25-4958
- 0 Lot9 Unit 2 Ph 2 Stillwater Unit 25-4967
- 0 Lot2 Unit 2 Ph 2 Stillwater Unit 25-4960
- 0 Lot11 Unit 2 Ph 2 Stillwater Unit 25-4953
- 0 Lot10 Unit 2 Ph 2 Stillwater Unit 25-4952
- 0 Lot7 Unit 2 Ph 2 Stillwater Unit 25-4965
- 3232 Nicolet Ln
- 2415 Marion Ct
- 0000 Wyndham Pointe Subdivision
- 5812 Cedars Rd Unit 43
- 4945 Eastside Rd
- 4991 Eastside Rd
- 4941 Eastside Rd
- 4931 Eastside Rd
- 4919 Eastside Rd
- 5011 Eastside Rd
- 4911 Eastside Rd
- 0000 S Market St
- 2915 S Market St
- 0 S Market St
- 00 S Market St
- 2331 Wilsey Dr
- 2311 Wilsey Dr
- 2345 Wilsey Dr
- 4970-4972 Westside Rd
- 2361 Wilsey Dr
- 4890 Bonnyview Ave
- 4970 Westside Rd
- 2375 Wilsey Dr
- 5061 Eastside Rd
Your Personal Tour Guide
Ask me questions while you tour the home.