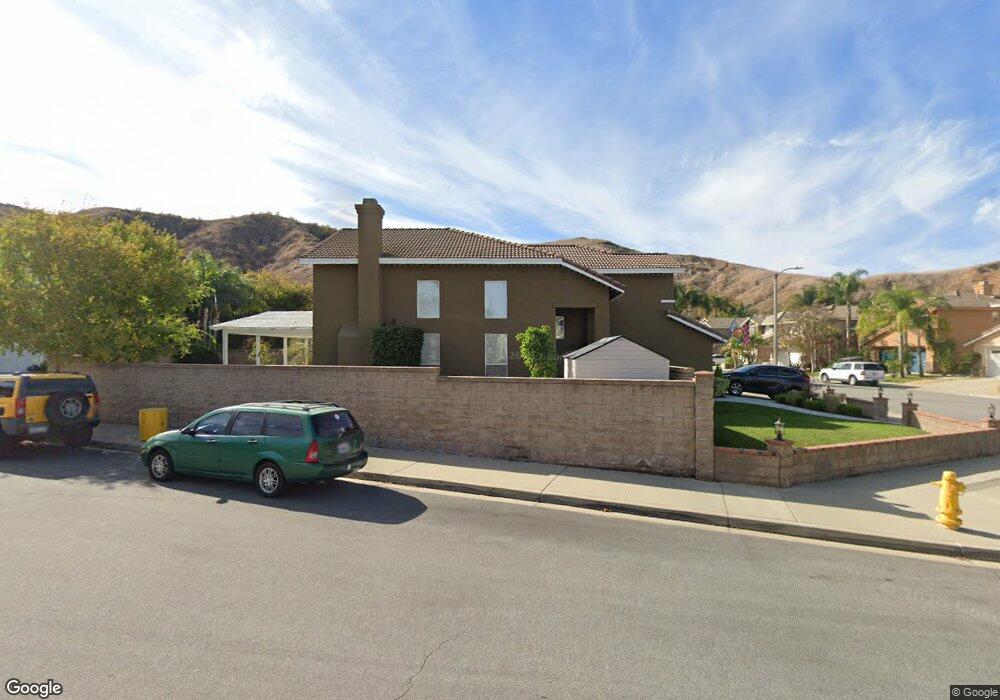
4961 Mandarin Ct Chino Hills, CA 91709
South Chino Hills NeighborhoodEstimated Value: $964,993 - $1,092,000
4
Beds
3
Baths
1,948
Sq Ft
$525/Sq Ft
Est. Value
About This Home
This home is located at 4961 Mandarin Ct, Chino Hills, CA 91709 and is currently estimated at $1,022,748, approximately $525 per square foot. 4961 Mandarin Ct is a home located in San Bernardino County with nearby schools including Michael G. Wickman Elementary School, Robert O. Townsend Junior High School, and Chino Hills High School.
Ownership History
Date
Name
Owned For
Owner Type
Purchase Details
Closed on
Oct 10, 1996
Sold by
Sumitomo Realty & Development Ca Inc
Bought by
Roll Steven A and Roll Sheri L
Current Estimated Value
Home Financials for this Owner
Home Financials are based on the most recent Mortgage that was taken out on this home.
Original Mortgage
$172,700
Interest Rate
7.88%
Create a Home Valuation Report for This Property
The Home Valuation Report is an in-depth analysis detailing your home's value as well as a comparison with similar homes in the area
Home Values in the Area
Average Home Value in this Area
Purchase History
| Date | Buyer | Sale Price | Title Company |
|---|---|---|---|
| Roll Steven A | $192,000 | Stewart Title |
Source: Public Records
Mortgage History
| Date | Status | Borrower | Loan Amount |
|---|---|---|---|
| Previous Owner | Roll Steven A | $172,700 |
Source: Public Records
Tax History Compared to Growth
Tax History
| Year | Tax Paid | Tax Assessment Tax Assessment Total Assessment is a certain percentage of the fair market value that is determined by local assessors to be the total taxable value of land and additions on the property. | Land | Improvement |
|---|---|---|---|---|
| 2025 | $3,028 | $260,372 | $52,009 | $208,363 |
| 2024 | $3,028 | $255,266 | $50,989 | $204,277 |
| 2023 | $2,950 | $250,261 | $49,989 | $200,272 |
| 2022 | $2,933 | $245,354 | $49,009 | $196,345 |
| 2021 | $3,516 | $240,543 | $48,048 | $192,495 |
| 2020 | $3,469 | $238,076 | $47,555 | $190,521 |
| 2019 | $3,410 | $233,408 | $46,623 | $186,785 |
| 2018 | $3,341 | $228,832 | $45,709 | $183,123 |
| 2017 | $3,284 | $224,345 | $44,813 | $179,532 |
| 2016 | $3,112 | $219,946 | $43,934 | $176,012 |
| 2015 | $3,055 | $216,642 | $43,274 | $173,368 |
| 2014 | $2,998 | $212,398 | $42,426 | $169,972 |
Source: Public Records
Map
Nearby Homes
- 4936 Highview St
- 4949 Highview St
- 16410 Argent Rd
- 16694 Tourmaline St
- 5176 Glenview St
- 5185 Highview St
- 16433 Garnet Way
- 16848 Morning Glory Ct
- 16349 Misty Hill Dr
- 5142 Cellini Dr
- 16340 Willowmist Ct
- 16631 Sagebrush St
- 4395 Saint Andrews Dr
- 16629 Quail Country Ave
- 5514 Lisboa St
- 15946 Ellington Way
- 15906 Kingston Rd
- 15892 Tanberry Dr
- 15920 Ellington Way
- 15849 Tanberry Dr
- 4951 Mandarin Ct
- 4941 Mandarin Ct
- 16600 Cerulean Ct
- 4931 Mandarin Ct
- 16620 Cerulean Ct
- 16605 Cerulean Ct
- 16597 Cerulean Ct
- 4946 Mandarin Ct
- 4940 Mandarin Ct
- 4958 Mandarin Ct
- 4921 Mandarin Ct
- 16589 Cerulean Ct
- 16613 Cerulean Ct
- 16629 Cerulean Ct
- 4934 Mandarin Ct
- 16621 Cerulean Ct
- 16581 Cerulean Ct
- 4928 Mandarin Ct
- 4911 Mandarin Ct
- 4922 Mandarin Ct