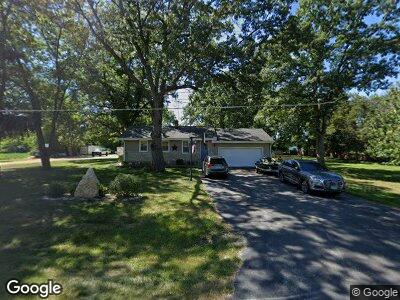
4964 N Wendorf Rd Monroe Center, IL 61052
Davis Junction NeighborhoodEstimated Value: $162,408 - $210,000
3
Beds
1
Bath
1,240
Sq Ft
$146/Sq Ft
Est. Value
About This Home
This home is located at 4964 N Wendorf Rd, Monroe Center, IL 61052 and is currently estimated at $181,602, approximately $146 per square foot. 4964 N Wendorf Rd is a home located in Ogle County with nearby schools including Highland Elementary School, Monroe Center Elementary School, and Meridian Junior High School.
Ownership History
Date
Name
Owned For
Owner Type
Purchase Details
Closed on
Jan 22, 2021
Sold by
Smith Eric R and Smith Jamie
Bought by
Carter Amy L
Current Estimated Value
Purchase Details
Closed on
Jan 24, 2008
Sold by
Smith Gregory W and Smith Susanne
Bought by
Smith Eric R
Home Financials for this Owner
Home Financials are based on the most recent Mortgage that was taken out on this home.
Original Mortgage
$123,068
Interest Rate
6.17%
Mortgage Type
New Conventional
Purchase Details
Closed on
Sep 1, 2005
Sold by
Meseck Kathy L
Bought by
Smith Gregory W and Smith Susanne
Home Financials for this Owner
Home Financials are based on the most recent Mortgage that was taken out on this home.
Original Mortgage
$230,000
Interest Rate
6.95%
Mortgage Type
Purchase Money Mortgage
Create a Home Valuation Report for This Property
The Home Valuation Report is an in-depth analysis detailing your home's value as well as a comparison with similar homes in the area
Home Values in the Area
Average Home Value in this Area
Purchase History
| Date | Buyer | Sale Price | Title Company |
|---|---|---|---|
| Carter Amy L | $125,000 | None Available | |
| Smith Eric R | $125,000 | None Available | |
| Smith Gregory W | $115,000 | None Available |
Source: Public Records
Mortgage History
| Date | Status | Borrower | Loan Amount |
|---|---|---|---|
| Previous Owner | Smith Eric R | $127,281 | |
| Previous Owner | Smith Eric R | $123,068 | |
| Previous Owner | Smith Gregory W | $230,000 |
Source: Public Records
Tax History Compared to Growth
Tax History
| Year | Tax Paid | Tax Assessment Tax Assessment Total Assessment is a certain percentage of the fair market value that is determined by local assessors to be the total taxable value of land and additions on the property. | Land | Improvement |
|---|---|---|---|---|
| 2024 | $3,225 | $41,875 | $8,310 | $33,565 |
| 2023 | $3,225 | $39,059 | $7,751 | $31,308 |
| 2022 | $2,925 | $35,739 | $7,092 | $28,647 |
| 2021 | $2,764 | $33,245 | $6,597 | $26,648 |
| 2020 | $2,384 | $28,466 | $3,017 | $25,449 |
| 2019 | $2,290 | $27,110 | $2,873 | $24,237 |
| 2018 | $2,261 | $26,130 | $2,769 | $23,361 |
| 2017 | $2,211 | $25,183 | $2,669 | $22,514 |
| 2016 | $1,647 | $24,653 | $2,613 | $22,040 |
| 2015 | $1,587 | $24,075 | $2,552 | $21,523 |
| 2014 | $1,498 | $24,075 | $2,552 | $21,523 |
| 2013 | $1,574 | $24,634 | $2,611 | $22,023 |
Source: Public Records
Map
Nearby Homes
- 15894 E Il Route 72
- 124 Primrose Ln
- 113 Jonquil Dr
- 104 Dayflower Cir
- 115 Jasmine Ave
- 406 Pacific St
- 102 N Walnut St
- 15333 E Mcneal Rd
- 1110 Burlington Way
- 2673 N Lynnville Rd
- 201 Autumnwood Ln
- 1103 Frosty Morning Dr
- 204 Autumnwood Ln
- 934 White Birch Ln
- 000 E Mcneal Rd
- 13244 E Lindenwood Rd
- 14189 E Dutch Rd
- 13965 E Dutch Rd
- 8465 S Mulford Rd
- Lot 5 Route 72 Hwy
- 4964 N Wendorf Rd
- 5044 N Wendorf Rd
- 5007 N Wendorf Rd
- 5050 N Wendorf Rd
- 4937 N Wendorf Rd
- 5084 N Wendorf Rd
- 4944 N Wendorf Rd
- 5051 N Wendorf Rd
- 5087 N Wendorf Rd
- 4980 N Wendorf Rd
- 4983 N Wendorf Rd
- 4967 N Wendorf Rd
- 5132 N Wendorf Rd
- 4935 N Wendorf Rd
- 5083 N Wendorf Rd
- 5049 N Wendorf Rd
- 4847 N Wendorf Rd
- 4924 N Wendorf Rd
- 4902 N Wendorf Rd
- 5135 N Wendorf Rd