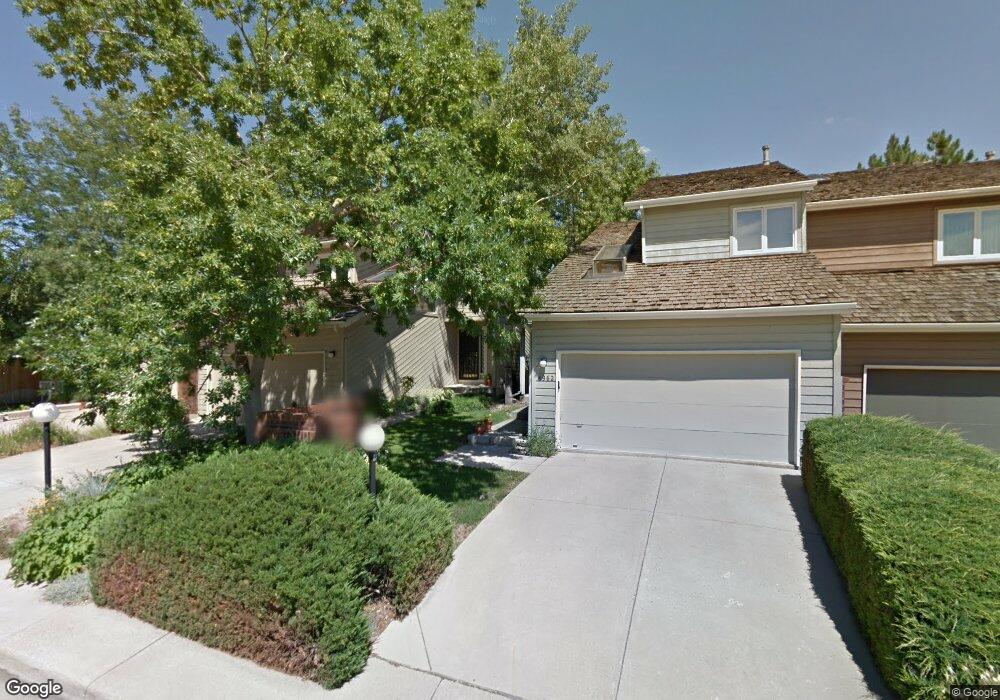
4964 Sundance Square Boulder, CO 80301
Gunbarrel NeighborhoodEstimated Value: $587,874 - $689,000
2
Beds
3
Baths
1,448
Sq Ft
$450/Sq Ft
Est. Value
About This Home
This home is located at 4964 Sundance Square, Boulder, CO 80301 and is currently estimated at $652,219, approximately $450 per square foot. 4964 Sundance Square is a home located in Boulder County with nearby schools including Heatherwood Elementary School, Nevin Platt Middle School, and Boulder High School.
Ownership History
Date
Name
Owned For
Owner Type
Purchase Details
Closed on
Oct 5, 2001
Sold by
Morgan Richard J and Morgan Joanne L
Bought by
Dodd Amy C
Current Estimated Value
Home Financials for this Owner
Home Financials are based on the most recent Mortgage that was taken out on this home.
Original Mortgage
$243,200
Outstanding Balance
$95,128
Interest Rate
6.88%
Estimated Equity
$557,091
Purchase Details
Closed on
Jul 12, 2001
Sold by
Morgan Richard J and Morgan Joanne L
Bought by
Morgan Richard J
Home Financials for this Owner
Home Financials are based on the most recent Mortgage that was taken out on this home.
Original Mortgage
$73,050
Interest Rate
7.18%
Purchase Details
Closed on
Nov 29, 1999
Sold by
Morgan Richard J and Morgan Jo Anne
Bought by
Morgan Richard J
Create a Home Valuation Report for This Property
The Home Valuation Report is an in-depth analysis detailing your home's value as well as a comparison with similar homes in the area
Home Values in the Area
Average Home Value in this Area
Purchase History
| Date | Buyer | Sale Price | Title Company |
|---|---|---|---|
| Dodd Amy C | $304,000 | -- | |
| Morgan Richard J | -- | Land Title | |
| Morgan Richard J | -- | -- | |
| Morgan Richard J | -- | -- |
Source: Public Records
Mortgage History
| Date | Status | Borrower | Loan Amount |
|---|---|---|---|
| Open | Dodd Amy C | $243,200 | |
| Previous Owner | Morgan Richard J | $73,050 |
Source: Public Records
Tax History Compared to Growth
Tax History
| Year | Tax Paid | Tax Assessment Tax Assessment Total Assessment is a certain percentage of the fair market value that is determined by local assessors to be the total taxable value of land and additions on the property. | Land | Improvement |
|---|---|---|---|---|
| 2025 | $3,387 | $44,731 | $19,225 | $25,506 |
| 2024 | $3,387 | $44,731 | $19,225 | $25,506 |
| 2023 | $3,331 | $43,161 | $20,830 | $26,016 |
| 2022 | $3,151 | $39,107 | $15,505 | $23,602 |
| 2021 | $3,005 | $40,233 | $15,952 | $24,281 |
| 2020 | $2,757 | $37,144 | $14,014 | $23,130 |
| 2019 | $2,714 | $37,144 | $14,014 | $23,130 |
| 2018 | $2,423 | $33,653 | $11,664 | $21,989 |
| 2017 | $2,351 | $37,205 | $12,895 | $24,310 |
| 2016 | $2,428 | $26,531 | $10,746 | $15,785 |
| 2015 | $2,306 | $24,445 | $12,736 | $11,709 |
| 2014 | $2,378 | $24,445 | $12,736 | $11,709 |
Source: Public Records
Map
Nearby Homes
- 4935 Sundance Square
- 7430 Clubhouse Rd
- 4936 Clubhouse Cir
- 5174 Buckingham Rd Unit L1
- 5128 Buckingham Rd
- 4953 Clubhouse Ct
- 4803 Briar Ridge Ct
- 4993 Clubhouse Ct
- 7481 Singing Hills Dr
- 7434 Singing Hills Ct Unit J7434
- 7443 Singing Hills Ct
- 7264 Siena Way Unit C
- 7400 Singing Hills Dr Unit K7400
- 7329 Windsor Dr
- 7309 Windsor Dr
- 4697 Tanglewood Trail
- 7302 Island Cir
- 5220 Desert Pine Ct
- 4667 Ashfield Dr
- 4716 Berkshire Ct
- 4962 Sundance Square
- 4960 Sundance Square
- 4966 Sundance Square
- 4958 Sundance Square
- 4958 Sundance Square Unit None
- 4956 Sundance Square
- 4954 Sundance Square
- 4965 Sundance Square
- 4948 Sundance Square
- 7490 Clubhouse Rd Unit 201
- 4963 Sundance Square
- 4937 Sundance Square
- 4952 Sundance Square
- 4939 Sundance Square
- 7438 Clubhouse Rd
- 4959 Sundance Square
- 7434 Clubhouse Rd
- 4941 Sundance Square
- 7426 Clubhouse Rd
- 4949 Sundance Square