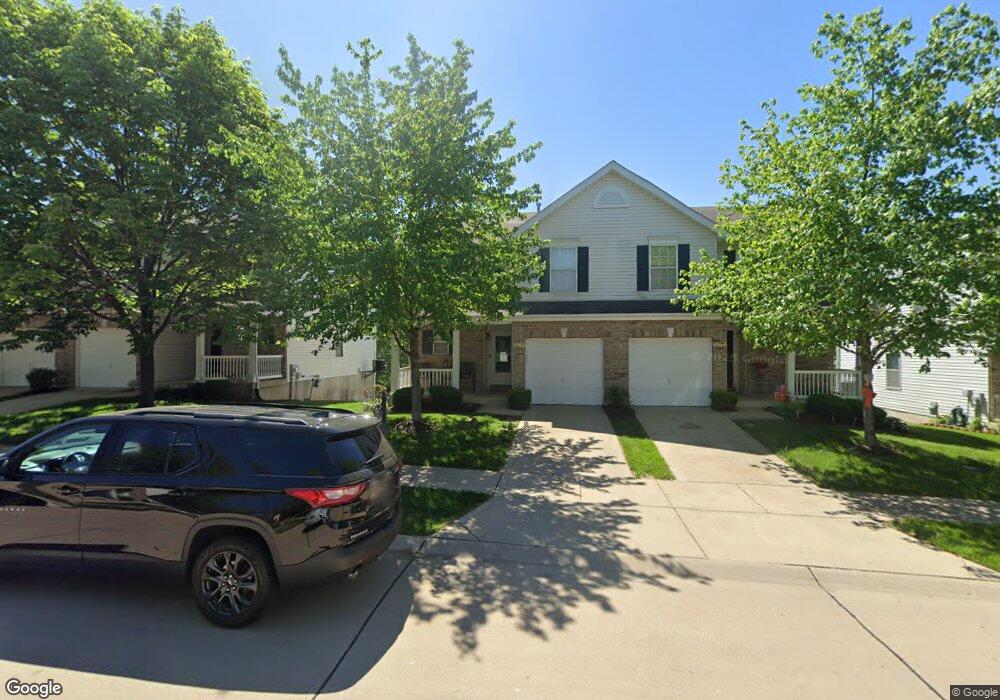
4966 Hurstborough Ct Hazelwood, MO 63042
Estimated Value: $210,000 - $239,000
2
Beds
3
Baths
1,414
Sq Ft
$155/Sq Ft
Est. Value
About This Home
This home is located at 4966 Hurstborough Ct, Hazelwood, MO 63042 and is currently estimated at $219,272, approximately $155 per square foot. 4966 Hurstborough Ct is a home located in St. Louis County with nearby schools including Garrett Elementary School, West Middle School, and Hazelwood West High School.
Ownership History
Date
Name
Owned For
Owner Type
Purchase Details
Closed on
Mar 28, 2020
Sold by
Carter Antonio D
Bought by
Carter Ingrid D and Carter Antonio C
Current Estimated Value
Purchase Details
Closed on
Oct 27, 2012
Sold by
Waters Patrick and Waters Cynthia
Bought by
Carter Antonio D
Home Financials for this Owner
Home Financials are based on the most recent Mortgage that was taken out on this home.
Original Mortgage
$3,443
Outstanding Balance
$2,377
Interest Rate
3.37%
Mortgage Type
Stand Alone Second
Estimated Equity
$216,895
Purchase Details
Closed on
Apr 29, 2005
Sold by
Mcbride & Son Homes Inc
Bought by
Waters Patrick and Waters Cynthia
Home Financials for this Owner
Home Financials are based on the most recent Mortgage that was taken out on this home.
Original Mortgage
$135,500
Interest Rate
6.06%
Mortgage Type
Fannie Mae Freddie Mac
Create a Home Valuation Report for This Property
The Home Valuation Report is an in-depth analysis detailing your home's value as well as a comparison with similar homes in the area
Home Values in the Area
Average Home Value in this Area
Purchase History
| Date | Buyer | Sale Price | Title Company |
|---|---|---|---|
| Carter Ingrid D | -- | None Available | |
| Carter Antonio D | $116,900 | Investors Title Co Clayton | |
| Waters Patrick | $169,479 | -- |
Source: Public Records
Mortgage History
| Date | Status | Borrower | Loan Amount |
|---|---|---|---|
| Open | Carter Antonio D | $3,443 | |
| Open | Carter Antonio D | $114,782 | |
| Previous Owner | Waters Patrick | $135,500 |
Source: Public Records
Tax History Compared to Growth
Tax History
| Year | Tax Paid | Tax Assessment Tax Assessment Total Assessment is a certain percentage of the fair market value that is determined by local assessors to be the total taxable value of land and additions on the property. | Land | Improvement |
|---|---|---|---|---|
| 2025 | $2,500 | $38,820 | $5,210 | $33,610 |
| 2024 | $2,500 | $30,950 | $2,770 | $28,180 |
| 2023 | $2,535 | $30,950 | $2,770 | $28,180 |
| 2022 | $2,401 | $26,200 | $3,990 | $22,210 |
| 2021 | $2,360 | $26,200 | $3,990 | $22,210 |
| 2020 | $2,198 | $22,820 | $2,090 | $20,730 |
| 2019 | $2,167 | $22,820 | $2,090 | $20,730 |
| 2018 | $2,149 | $20,980 | $1,390 | $19,590 |
| 2017 | $2,136 | $20,980 | $1,390 | $19,590 |
| 2016 | $2,172 | $21,150 | $2,090 | $19,060 |
| 2015 | $2,086 | $21,150 | $2,090 | $19,060 |
| 2014 | $2,140 | $21,600 | $6,080 | $15,520 |
Source: Public Records
Map
Nearby Homes
- 12600 Missouri Bottom Rd
- 5156 Carey Ln
- 1748 Spring Forest Ln
- 12 Ville Donna Ct
- 4921 Tulip Tree Ln
- 1496 Ville Rosa Ln
- 5345 Ville Angela Ln
- 5365 Ville Rosa Ln
- 1514 Laurel Bluffs Dr
- 1327 Eagles Way Ct
- 1307 Eagles Way Ct
- 6746 Barnwood Dr
- 1212 Woodcrest Ln
- 1209 Woodcrest Ln
- 4040 Locke Ave
- 4229 Carrollton Dr Unit C
- 4151 Scotch Dr
- 4159 Gallatin Ln Unit B
- 4115 Scotch Dr
- 4151 Lockport Dr
- 4964 Hurstborough Ct
- 4968 Hurstborough Ct
- 4962 Hurstborough Ct
- 4970 Hurstborough Ct
- 4960 Hurstborough Ct
- 4972 Hurstborough Ct
- 1637 Hurstborough Manor Dr
- 1641 Hurstborough Manor Dr
- 4974 Hurstborough Ct
- 1643 Hurstborough Manor Dr
- 4958 Hurstborough Ct
- 1635 Hurstborough Manor Dr
- 1645 Hurstborough Manor Dr
- 4956 Hurstborough Ct
- 4976 Hurstborough Ct
- 4965 Hurstborough Ct
- 1633 Hurstborough Manor Dr
- 1633 Hurstborough
- 4963 Hurstborough Ct
- 1647 Hurstborough Manor Dr