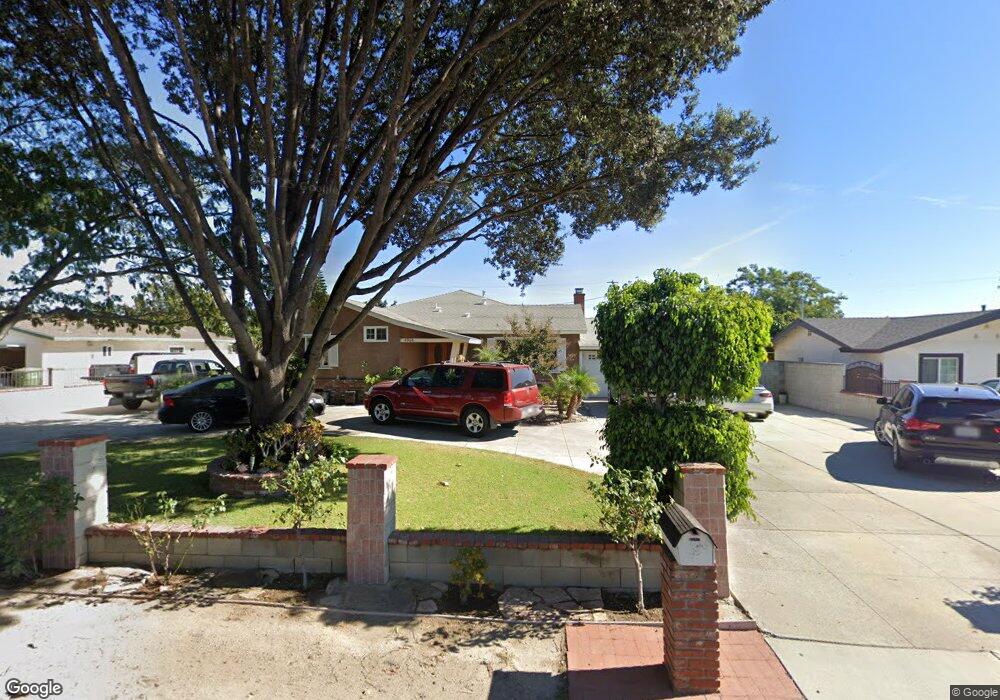
4966 Maureen Ln Moorpark, CA 93021
Estimated Value: $950,000 - $989,339
4
Beds
3
Baths
2,030
Sq Ft
$478/Sq Ft
Est. Value
About This Home
This home is located at 4966 Maureen Ln, Moorpark, CA 93021 and is currently estimated at $969,835, approximately $477 per square foot. 4966 Maureen Ln is a home located in Ventura County with nearby schools including Walnut Canyon Elementary School, Chaparral Middle School, and Moorpark High School.
Ownership History
Date
Name
Owned For
Owner Type
Purchase Details
Closed on
Jan 14, 2017
Sold by
Ceja Alfonso and Ceja Anabel
Bought by
Quezada Jose Luis and Quezada Esmeralda
Current Estimated Value
Purchase Details
Closed on
Jul 26, 2011
Sold by
Union Bank N A
Bought by
Ceja Alfonso and Ceja Anabel
Home Financials for this Owner
Home Financials are based on the most recent Mortgage that was taken out on this home.
Original Mortgage
$349,250
Interest Rate
4.43%
Mortgage Type
New Conventional
Purchase Details
Closed on
Dec 22, 2010
Sold by
Gonzalez Arnoldo and Gonzalez Alma D
Bought by
Union Bank Na
Purchase Details
Closed on
Feb 26, 2004
Sold by
Mp Group Llc
Bought by
Gonzalez Arnoldo and Gonzalez Alma D
Create a Home Valuation Report for This Property
The Home Valuation Report is an in-depth analysis detailing your home's value as well as a comparison with similar homes in the area
Home Values in the Area
Average Home Value in this Area
Purchase History
| Date | Buyer | Sale Price | Title Company |
|---|---|---|---|
| Quezada Jose Luis | -- | None Available | |
| Ceja Alfonso | $440,000 | Fidelity National Title Co | |
| Union Bank Na | $138,120 | Pacific Coast Title | |
| Gonzalez Arnoldo | -- | First American Oxnard |
Source: Public Records
Mortgage History
| Date | Status | Borrower | Loan Amount |
|---|---|---|---|
| Previous Owner | Ceja Alfonso | $349,250 |
Source: Public Records
Tax History Compared to Growth
Tax History
| Year | Tax Paid | Tax Assessment Tax Assessment Total Assessment is a certain percentage of the fair market value that is determined by local assessors to be the total taxable value of land and additions on the property. | Land | Improvement |
|---|---|---|---|---|
| 2025 | $6,991 | $660,771 | $426,290 | $234,481 |
| 2024 | $6,991 | $647,815 | $417,931 | $229,884 |
| 2023 | $6,834 | $635,113 | $409,736 | $225,377 |
| 2022 | $6,655 | $622,660 | $401,702 | $220,958 |
| 2021 | $6,717 | $610,451 | $393,825 | $216,626 |
| 2020 | $6,654 | $604,193 | $389,788 | $214,405 |
| 2019 | $6,505 | $592,347 | $382,146 | $210,201 |
| 2018 | $6,439 | $580,733 | $374,653 | $206,080 |
| 2017 | $5,219 | $476,189 | $304,113 | $172,076 |
| 2016 | $5,119 | $466,852 | $298,150 | $168,702 |
| 2015 | $5,047 | $459,841 | $293,672 | $166,169 |
| 2014 | $4,909 | $450,835 | $287,920 | $162,915 |
Source: Public Records
Map
Nearby Homes
- Plan 2428 Modeled at The Bungalows at Beltramo
- Plan 2288 Modeled at The Bungalows at Beltramo
- Plan 1908 at The Bungalows at Beltramo
- 4833 E Beltramo Ranch Rd
- 4844 Arroyo Run
- 4820 Arroyo Run
- 4819 E Beltramo Ranch Rd
- 4827 E Beltramo Ranch Rd
- 4744 Elderberry Ave
- 4471 Skyglen Ct
- 4429 Summerglen Ct
- 12401 Willow Forest Dr
- 4992 N Buttercreek Rd
- 4615 Pepper Mill St
- 11928 River Grove Ct
- 4529 N Canyonlands Rd
- 6397 Gabbert Rd
- 4506 N Canyonlands Rd
- 4196 Hillbrook Ct
- 150 Majestic Ct Unit 1102
- 4980 Maureen Ln
- 4934 Maureen Ln
- 4922 Maureen Ln
- 4910 Maureen Ln
- 4886 Maureen Ln
- 4967 Maureen Ln
- 4935 Maureen Ln
- 4981 Maureen Ln
- 4911 Maureen Ln
- 4864 Maureen Ln
- 4887 Maureen Ln
- 4832 Maureen Ln
- 4865 Maureen Ln
- 4890 E Beltramo Ranch Rd Unit 36560766
- 4812 Arroyo Run
- 4808 Maureen Ln
- 4833 Maureen Ln
- 4830 Arroyo Run
- 4836 Arroyo Run
- 4890 Beltramo Ranch Rd Unit 36438819