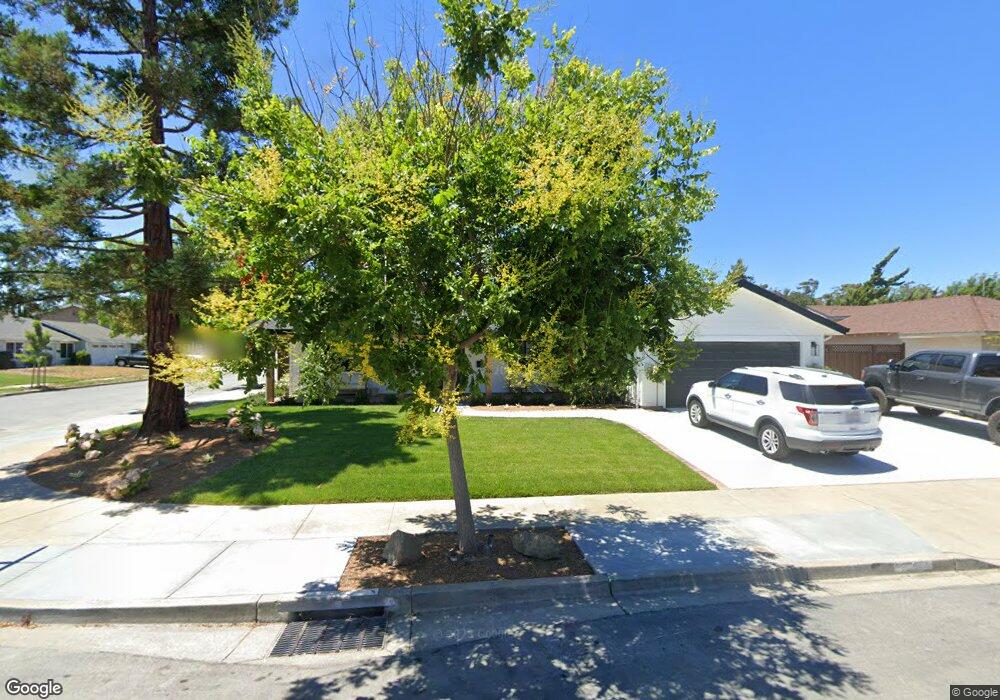
4967 Bosworth Ct Newark, CA 94560
Estimated Value: $1,245,000 - $1,620,876
3
Beds
1
Bath
1,008
Sq Ft
$1,447/Sq Ft
Est. Value
About This Home
This home is located at 4967 Bosworth Ct, Newark, CA 94560 and is currently estimated at $1,458,719, approximately $1,447 per square foot. 4967 Bosworth Ct is a home located in Alameda County with nearby schools including John F. Kennedy Elementary School, Newark Junior High School, and Newark Memorial High School.
Ownership History
Date
Name
Owned For
Owner Type
Purchase Details
Closed on
Aug 13, 2019
Sold by
Lubbers Bryan L and Bryan L Lubbers Revocable Trus
Bought by
Tolbertson Christopher G and Tolbertson Brittnee E
Current Estimated Value
Home Financials for this Owner
Home Financials are based on the most recent Mortgage that was taken out on this home.
Original Mortgage
$633,600
Outstanding Balance
$556,053
Interest Rate
3.8%
Mortgage Type
New Conventional
Estimated Equity
$902,666
Purchase Details
Closed on
Jun 5, 2017
Sold by
Lubbers Bryan Lee
Bought by
Lubbers Bryan L and Bryan L Lubbers Revocable Trus
Purchase Details
Closed on
Jun 23, 1997
Sold by
Lubbers Bryan Lee and Culhane Judith I
Bought by
Lubbers Bryan Lee
Purchase Details
Closed on
Apr 10, 1995
Sold by
Doerfer Ellen D
Bought by
Lubbers Bryan Lee and Culhane Judith I
Home Financials for this Owner
Home Financials are based on the most recent Mortgage that was taken out on this home.
Original Mortgage
$178,100
Interest Rate
8.6%
Create a Home Valuation Report for This Property
The Home Valuation Report is an in-depth analysis detailing your home's value as well as a comparison with similar homes in the area
Home Values in the Area
Average Home Value in this Area
Purchase History
| Date | Buyer | Sale Price | Title Company |
|---|---|---|---|
| Tolbertson Christopher G | $792,000 | Old Republic Title Company | |
| Lubbers Bryan L | -- | None Available | |
| Lubbers Bryan Lee | -- | -- | |
| Lubbers Bryan Lee | $187,500 | First American Title Guarant |
Source: Public Records
Mortgage History
| Date | Status | Borrower | Loan Amount |
|---|---|---|---|
| Open | Tolbertson Christopher G | $633,600 | |
| Previous Owner | Lubbers Bryan Lee | $178,100 |
Source: Public Records
Tax History Compared to Growth
Tax History
| Year | Tax Paid | Tax Assessment Tax Assessment Total Assessment is a certain percentage of the fair market value that is determined by local assessors to be the total taxable value of land and additions on the property. | Land | Improvement |
|---|---|---|---|---|
| 2025 | $12,333 | $1,021,456 | $355,429 | $673,027 |
| 2024 | $12,333 | $1,001,293 | $348,461 | $659,832 |
| 2023 | $12,010 | $988,526 | $341,630 | $646,896 |
| 2022 | $10,174 | $816,203 | $334,932 | $481,271 |
| 2021 | $9,919 | $800,205 | $328,367 | $471,838 |
| 2020 | $9,813 | $792,000 | $325,000 | $467,000 |
| 2019 | $3,835 | $285,071 | $84,240 | $200,831 |
| 2018 | $3,773 | $279,482 | $82,588 | $196,894 |
| 2017 | $3,676 | $274,003 | $80,969 | $193,034 |
| 2016 | $3,627 | $268,632 | $79,382 | $189,250 |
| 2015 | $3,613 | $264,598 | $78,190 | $186,408 |
| 2014 | $3,511 | $259,416 | $76,659 | $182,757 |
Source: Public Records
Map
Nearby Homes
- 35220 Cornwall Place
- 35345 Cabral Dr
- 35605 Scarborough Dr
- 34771 Tuxedo Common Unit 52
- 5093 Dorking Ct
- 5303 Stirling Ct
- 34768 Swain Common
- 34627 Pueblo Terrace
- 34607 Pueblo Terrace
- 35377 Cabrillo Dr
- 34565 Pueblo Terrace
- 35794 Cabral Dr
- 5176 Tacoma Common
- 4987 Winchester Place
- 35856 Adobe Dr
- 4626 Alhambra Dr
- 34648 Musk Terrace
- 35936 Magellan Dr
- 5220 Fairbanks Common
- 5308 Tacoma Common
- 4955 Bosworth Ct
- 4982 Windermere Dr
- 4966 Windermere Dr
- 35117 Windermere Dr
- 4943 Bosworth Ct
- 35139 Windermere Dr
- 4970 Bosworth Ct
- 35105 Windermere Dr
- 4958 Bosworth Ct
- 4952 Windermere Dr
- 35151 Windermere Dr
- 35093 Windermere Dr
- 4946 Bosworth Ct
- 4931 Bosworth Ct
- 35146 Maidstone Ct
- 35124 Maidstone Ct
- 4934 Windermere Dr
- 35168 Maidstone Ct
- 35232 Farnham Dr
- 35102 Maidstone Ct