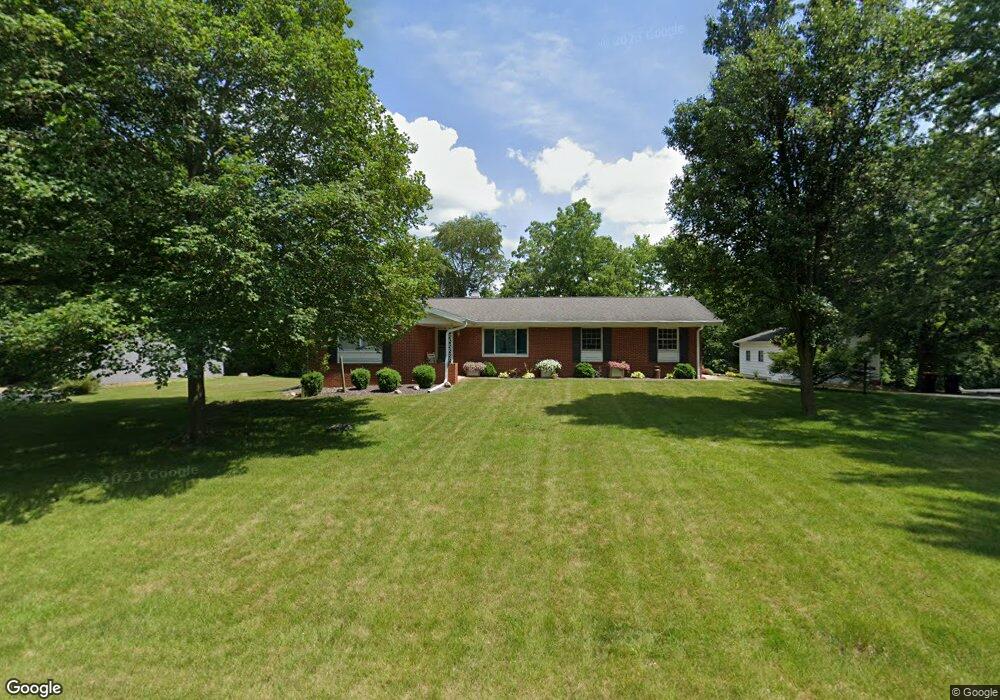
4967 Camelback Rd Heyworth, IL 61745
Estimated Value: $208,000 - $258,000
3
Beds
2
Baths
2,432
Sq Ft
$97/Sq Ft
Est. Value
About This Home
This home is located at 4967 Camelback Rd, Heyworth, IL 61745 and is currently estimated at $236,234, approximately $97 per square foot. 4967 Camelback Rd is a home located in McLean County with nearby schools including Heyworth Elementary School and Heyworth Junior/Senior High School.
Ownership History
Date
Name
Owned For
Owner Type
Purchase Details
Closed on
Jul 9, 2012
Sold by
Houston Robert L and Houston M A
Bought by
Houston Cameron T and Houston Danielle A
Current Estimated Value
Home Financials for this Owner
Home Financials are based on the most recent Mortgage that was taken out on this home.
Original Mortgage
$115,000
Interest Rate
3.5%
Purchase Details
Closed on
Apr 15, 2011
Sold by
Childers Charles Frederick
Bought by
Houston Robert L and Houston M A
Home Financials for this Owner
Home Financials are based on the most recent Mortgage that was taken out on this home.
Original Mortgage
$96,000
Interest Rate
4.92%
Purchase Details
Closed on
Sep 5, 2007
Sold by
Childers Charlers Frederick
Bought by
Childers Charles Frederick and The Charles Frederick Childers Irrevocab
Purchase Details
Closed on
Jan 17, 2007
Sold by
Childers Charles F and Childers Marjorie
Bought by
Childers Charles F
Create a Home Valuation Report for This Property
The Home Valuation Report is an in-depth analysis detailing your home's value as well as a comparison with similar homes in the area
Purchase History
| Date | Buyer | Sale Price | Title Company |
|---|---|---|---|
| Houston Cameron T | $115,000 | None Available | |
| Houston Robert L | $120,000 | None Available | |
| Childers Charles Frederick | -- | None Available | |
| Childers Charles F | -- | None Available |
Source: Public Records
Mortgage History
| Date | Status | Borrower | Loan Amount |
|---|---|---|---|
| Previous Owner | Houston Cameron T | $115,000 | |
| Previous Owner | Houston Robert L | $96,000 |
Source: Public Records
Tax History
| Year | Tax Paid | Tax Assessment Tax Assessment Total Assessment is a certain percentage of the fair market value that is determined by local assessors to be the total taxable value of land and additions on the property. | Land | Improvement |
|---|---|---|---|---|
| 2024 | $3,822 | $62,035 | $12,832 | $49,203 |
| 2022 | $3,822 | $51,966 | $10,749 | $41,217 |
| 2021 | $3,727 | $49,848 | $10,311 | $39,537 |
| 2020 | $3,712 | $49,175 | $10,172 | $39,003 |
| 2019 | $3,679 | $48,823 | $10,099 | $38,724 |
| 2018 | $3,688 | $48,823 | $10,099 | $38,724 |
| 2017 | $3,622 | $48,440 | $10,020 | $38,420 |
| 2016 | $3,339 | $48,440 | $10,020 | $38,420 |
| 2015 | $3,246 | $46,938 | $9,709 | $37,229 |
| 2014 | $3,207 | $46,938 | $9,709 | $37,229 |
| 2013 | -- | $46,938 | $9,709 | $37,229 |
Source: Public Records
Map
Nearby Homes
- 202 Comet Ln
- 14607 Knob Hill Dr
- 2nd Addition Whitetail S
- 3312 N 1475 East Rd
- 13532 E 600 North Rd
- LOT 63 and 78 Cobble Creek Ln
- 512 E Pease St
- 704 Russell Ct
- 404 N Delane Dr
- 610 Kelley Dr
- 401 Jenny Ln
- Lot 32 - 15875 Belfry Dr
- Lot 13 - 15850 Palmer Way
- Lot 14 - 15940 Crestwicke Dr
- 8627 Oakmont Rd
- 8989 Tamarac Way
- Lot 8 E 700 Rd N
- N 2000 East Rd
- 103 Bowz Dr
- 109 Dugan Trail
- 4947 Camelback Rd
- 4983 Camelback Rd
- 4968 Camelback Rd
- 4982 Camelback Rd
- 4946 Camelback Rd
- 4933 Camelback Rd
- 4997 Camelback Rd
- 15365 Mountain View
- 4932 Camelback Rd
- 15349 Mountain View
- 4965 Country Ln
- 4977 Country Ln
- 4999 Camelback Rd
- 15394 Mountain View
- 4915 Camelback Rd
- 4916 Camelback Rd
- 15356 Mountain View
- 15327 Mountain View
- 4978 Country Ln
- 15338 Mountain View
Your Personal Tour Guide
Ask me questions while you tour the home.