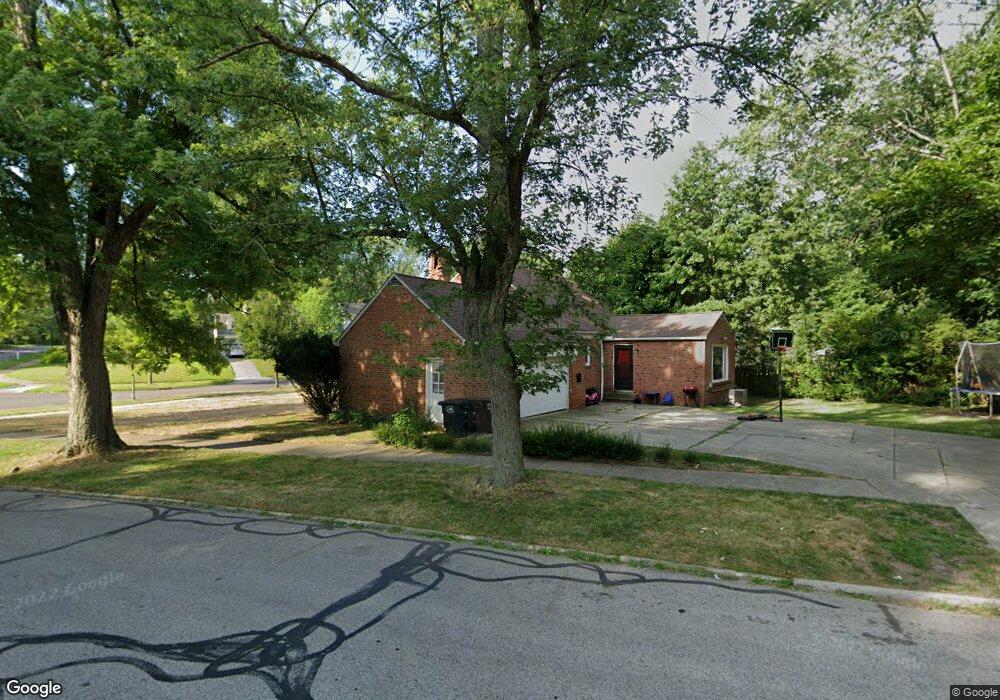
4967 Farnhurst Rd Cleveland, OH 44124
Estimated Value: $222,000 - $250,000
4
Beds
2
Baths
2,323
Sq Ft
$101/Sq Ft
Est. Value
About This Home
This home is located at 4967 Farnhurst Rd, Cleveland, OH 44124 and is currently estimated at $235,129, approximately $101 per square foot. 4967 Farnhurst Rd is a home located in Cuyahoga County with nearby schools including Sunview Elementary School, Greenview Upper Elementary School, and Memorial Junior High School.
Ownership History
Date
Name
Owned For
Owner Type
Purchase Details
Closed on
Oct 29, 2010
Sold by
U S Bank National Association
Bought by
Star Investment Group Llc
Current Estimated Value
Purchase Details
Closed on
Jul 22, 2010
Sold by
Rakhmanov Lev M
Bought by
U S Bank National Association
Purchase Details
Closed on
Feb 28, 1995
Sold by
Costanzo Josephine
Bought by
Rakhmanov Lev M and Rakhmanov Tatyana V
Home Financials for this Owner
Home Financials are based on the most recent Mortgage that was taken out on this home.
Original Mortgage
$99,000
Interest Rate
9.21%
Mortgage Type
New Conventional
Purchase Details
Closed on
Feb 22, 1983
Sold by
Costanzo Josephine
Bought by
Josephine Costanzo
Purchase Details
Closed on
Jan 11, 1983
Sold by
Frank A Costanzo
Bought by
Costanzo Josephine
Purchase Details
Closed on
Apr 28, 1978
Bought by
Frank A Costanzo
Purchase Details
Closed on
Jan 1, 1975
Bought by
Josephine
Create a Home Valuation Report for This Property
The Home Valuation Report is an in-depth analysis detailing your home's value as well as a comparison with similar homes in the area
Home Values in the Area
Average Home Value in this Area
Purchase History
| Date | Buyer | Sale Price | Title Company |
|---|---|---|---|
| Star Investment Group Llc | $66,500 | Resource Title Agency | |
| U S Bank National Association | $50,000 | None Available | |
| Rakhmanov Lev M | $110,000 | -- | |
| Josephine Costanzo | $20,000 | -- | |
| Costanzo Josephine | -- | -- | |
| Frank A Costanzo | $20,000 | -- | |
| Josephine | -- | -- |
Source: Public Records
Mortgage History
| Date | Status | Borrower | Loan Amount |
|---|---|---|---|
| Previous Owner | Rakhmanov Lev M | $99,000 |
Source: Public Records
Tax History Compared to Growth
Tax History
| Year | Tax Paid | Tax Assessment Tax Assessment Total Assessment is a certain percentage of the fair market value that is determined by local assessors to be the total taxable value of land and additions on the property. | Land | Improvement |
|---|---|---|---|---|
| 2024 | $4,250 | $58,975 | $11,480 | $47,495 |
| 2023 | $4,627 | $52,080 | $8,960 | $43,120 |
| 2022 | $4,601 | $52,080 | $8,960 | $43,120 |
| 2021 | $4,564 | $52,080 | $8,960 | $43,120 |
| 2020 | $4,280 | $45,780 | $7,350 | $38,430 |
| 2019 | $4,136 | $130,800 | $21,000 | $109,800 |
| 2018 | $4,115 | $45,780 | $7,350 | $38,430 |
| 2017 | $4,177 | $42,710 | $7,320 | $35,390 |
| 2016 | $4,144 | $42,710 | $7,320 | $35,390 |
| 2015 | $4,194 | $42,710 | $7,320 | $35,390 |
| 2014 | $4,194 | $43,580 | $7,460 | $36,120 |
Source: Public Records
Map
Nearby Homes
- 1333 Clearview Rd
- 4988 Edsal Dr
- 1387 Richmond Rd
- 4852 Edsal Dr
- 5108 E Farnhurst Rd
- 5103 Eastover Rd
- 4800 Farnhurst Rd
- 5118 Spencer Rd
- 4838 N Sedgewick Rd
- 4866 Fairlawn Rd
- 1512 Parkside Cir
- 5027 Bristol Ct
- 1432 Willshire Rd
- 5144 Oakmont Dr
- 4695 Mayfield Rd Unit A
- 4705 Mayfield Rd Unit B
- 4685 Mayfield Rd Unit F
- 5159 Haverford Dr
- 4669 Liberty Rd
- 4769 Edenwood Rd
- 4955 Farnhurst Rd
- 4951 Farnhurst Rd
- 4956 Westbourne Rd
- 4979 Farnhurst Rd
- 4947 Farnhurst Rd
- 4952 Westbourne Rd
- 4968 Farnhurst Rd
- 4964 Farnhurst Rd
- 4984 Farnhurst Rd
- 4983 Farnhurst Rd
- 4960 Farnhurst Rd
- 4948 Westbourne Rd
- 4939 Farnhurst Rd
- 4956 Farnhurst Rd
- 4988 Farnhurst Rd
- 4940 Westbourne Rd
- 4952 Farnhurst Rd
- 4987 Farnhurst Rd
- 4935 Farnhurst Rd
- 4948 Farnhurst Rd