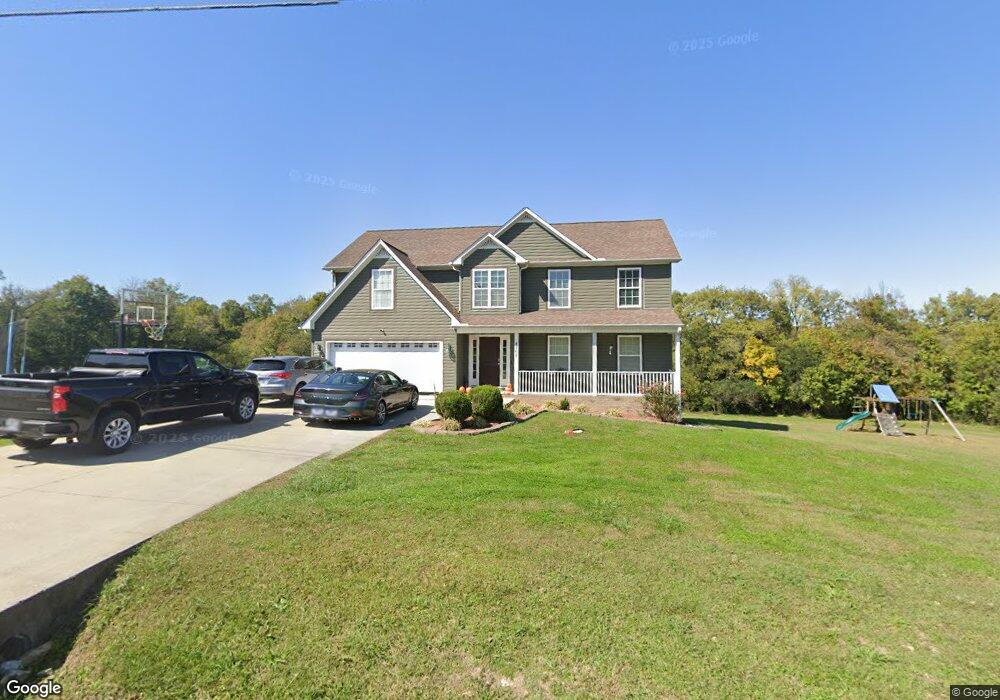
4968 Cedar Creek Cir Cookeville, TN 38501
Estimated Value: $435,204 - $543,000
5
Beds
4
Baths
2,634
Sq Ft
$189/Sq Ft
Est. Value
About This Home
This home is located at 4968 Cedar Creek Cir, Cookeville, TN 38501 and is currently estimated at $497,301, approximately $188 per square foot. 4968 Cedar Creek Cir is a home located in Putnam County with nearby schools including Baxter Primary School, Cornerstone Elementary School, and Upperman Middle School.
Ownership History
Date
Name
Owned For
Owner Type
Purchase Details
Closed on
Jan 11, 2011
Sold by
Sullivan Dale
Bought by
Evans Charm
Current Estimated Value
Home Financials for this Owner
Home Financials are based on the most recent Mortgage that was taken out on this home.
Original Mortgage
$237,167
Outstanding Balance
$162,002
Interest Rate
4.82%
Estimated Equity
$335,299
Purchase Details
Closed on
Dec 21, 2010
Sold by
Master Builders Llc
Bought by
Evans Charm
Home Financials for this Owner
Home Financials are based on the most recent Mortgage that was taken out on this home.
Original Mortgage
$237,167
Outstanding Balance
$162,002
Interest Rate
4.82%
Estimated Equity
$335,299
Purchase Details
Closed on
Jun 16, 2010
Sold by
Hammock Andy
Bought by
Master Builders Llc
Purchase Details
Closed on
Feb 5, 1972
Bought by
Dyer Hulon and Dyer Morine
Create a Home Valuation Report for This Property
The Home Valuation Report is an in-depth analysis detailing your home's value as well as a comparison with similar homes in the area
Home Values in the Area
Average Home Value in this Area
Purchase History
| Date | Buyer | Sale Price | Title Company |
|---|---|---|---|
| Evans Charm | -- | -- | |
| Evans Charm | $256,644 | -- | |
| Master Builders Llc | $29,500 | -- | |
| Dyer Hulon | -- | -- |
Source: Public Records
Mortgage History
| Date | Status | Borrower | Loan Amount |
|---|---|---|---|
| Open | Evans Charm | $237,167 | |
| Closed | Evans Charm | $237,167 |
Source: Public Records
Tax History Compared to Growth
Tax History
| Year | Tax Paid | Tax Assessment Tax Assessment Total Assessment is a certain percentage of the fair market value that is determined by local assessors to be the total taxable value of land and additions on the property. | Land | Improvement |
|---|---|---|---|---|
| 2024 | $1,958 | $73,625 | $10,625 | $63,000 |
| 2023 | $1,958 | $73,625 | $10,625 | $63,000 |
| 2022 | $1,820 | $73,625 | $10,625 | $63,000 |
| 2021 | $1,820 | $73,625 | $10,625 | $63,000 |
| 2020 | $1,995 | $73,625 | $10,625 | $63,000 |
| 2019 | $1,887 | $68,175 | $10,625 | $57,550 |
| 2018 | $1,760 | $64,475 | $10,625 | $53,850 |
| 2017 | $1,760 | $64,475 | $10,625 | $53,850 |
| 2016 | $1,760 | $64,475 | $10,625 | $53,850 |
| 2015 | $1,809 | $64,475 | $10,625 | $53,850 |
| 2014 | $1,686 | $60,090 | $0 | $0 |
Source: Public Records
Map
Nearby Homes
- 1920 Clemmons Rd
- 1764 Bouton Dr
- 2312 Benjy Cir
- 3815 Spurgeon Dr
- 0 Bloomington Rd
- 1711 Creekside Dr
- 1775 Creekside Dr
- 3709 Poundstone Dr
- 918 Faye Dr
- 4763 Cumby Rd
- 4746 Maple Shade Cir
- 2618 Whispering Oak Ln
- 2450 Whispering Oaks Ln
- 177 Prosperity Dr
- 2694 Whispering Oaks Ln
- 2600 Whispering Oaks Ln
- 2636 Whispering Oaks Ln
- 2870 Autumn Woods Trail
- 169 Prosperity Dr
- 2895 Autumn Woods Trail
- 4964 Cedar Creek Cir
- 4967 Cedar Creek Cir
- 4972 Cedar Creek Cir
- 4971 Cedar Creek Cir
- 4901 Cedar Creek Cir
- 4917 Cedar Creek Cir
- 4905 Cedar Creek Cir
- 4909 Cedar Creek Cir
- 4965 Cedar Creek Cir
- 4992 Cedar Creek Cir
- 4900 Cedar Creek Cir
- 4908 Cedar Creek Cir
- 4988 Cedar Creek Cir
- 4924 Cedar Creek Cir
- 4920 Cedar Creek Cir
- 4916 Cedar Creek Cir
- 4912 Cedar Creek Cir
- 4956 Cedar Creek Cir
- 4975 Cedar Creek Cir
- 4951 Cedar Creek Cir