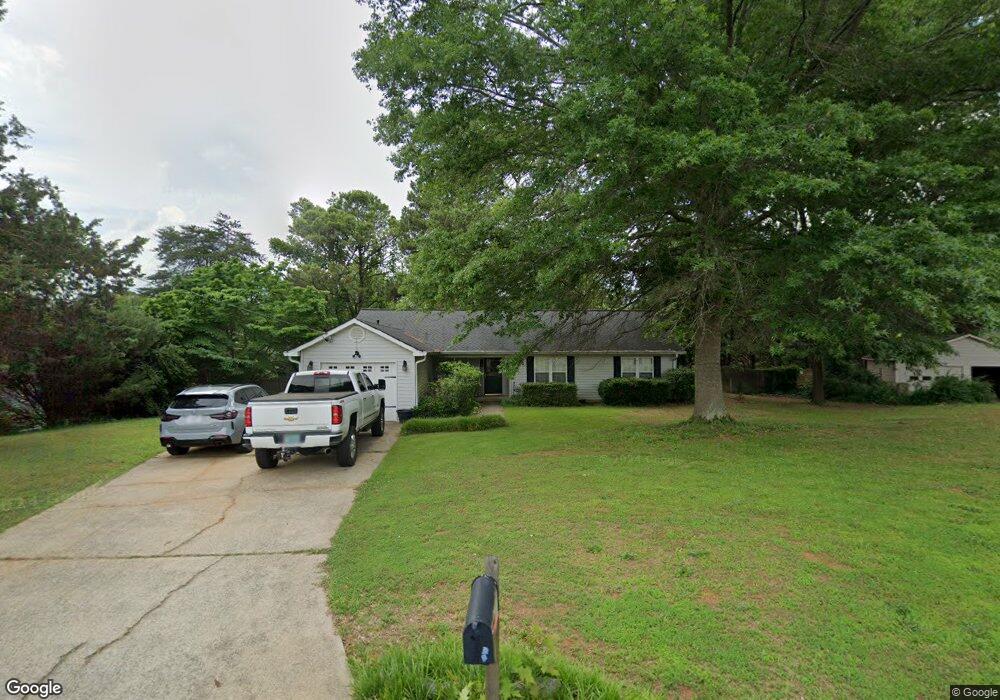
4969 Turtle Summit NE Unit 2 Marietta, GA 30066
Sandy Plains NeighborhoodEstimated Value: $341,806 - $382,000
3
Beds
2
Baths
1,441
Sq Ft
$255/Sq Ft
Est. Value
About This Home
This home is located at 4969 Turtle Summit NE Unit 2, Marietta, GA 30066 and is currently estimated at $367,952, approximately $255 per square foot. 4969 Turtle Summit NE Unit 2 is a home located in Cobb County with nearby schools including Davis Elementary School, Mabry Middle School, and Lassiter High School.
Ownership History
Date
Name
Owned For
Owner Type
Purchase Details
Closed on
Jun 13, 2014
Sold by
Jones Pamela L
Bought by
Usery-Blakley Stacy R
Current Estimated Value
Home Financials for this Owner
Home Financials are based on the most recent Mortgage that was taken out on this home.
Original Mortgage
$151,210
Outstanding Balance
$114,328
Interest Rate
4.12%
Mortgage Type
FHA
Estimated Equity
$253,624
Purchase Details
Closed on
Jul 28, 2006
Sold by
Buker Wayne E and Buker Lisa M
Bought by
Jones Pamela L
Home Financials for this Owner
Home Financials are based on the most recent Mortgage that was taken out on this home.
Original Mortgage
$100,000
Interest Rate
6.68%
Mortgage Type
New Conventional
Purchase Details
Closed on
Jul 3, 1997
Sold by
Jones Pamela L
Bought by
Buker Wayne E and Buker Lisa M
Home Financials for this Owner
Home Financials are based on the most recent Mortgage that was taken out on this home.
Original Mortgage
$78,221
Interest Rate
7.7%
Mortgage Type
FHA
Create a Home Valuation Report for This Property
The Home Valuation Report is an in-depth analysis detailing your home's value as well as a comparison with similar homes in the area
Home Values in the Area
Average Home Value in this Area
Purchase History
| Date | Buyer | Sale Price | Title Company |
|---|---|---|---|
| Usery-Blakley Stacy R | $154,000 | -- | |
| Jones Pamela L | $125,000 | -- | |
| Buker Wayne E | $80,000 | -- |
Source: Public Records
Mortgage History
| Date | Status | Borrower | Loan Amount |
|---|---|---|---|
| Open | Usery-Blakley Stacy R | $151,210 | |
| Previous Owner | Jones Pamela L | $100,000 | |
| Previous Owner | Buker Wayne E | $78,221 |
Source: Public Records
Tax History Compared to Growth
Tax History
| Year | Tax Paid | Tax Assessment Tax Assessment Total Assessment is a certain percentage of the fair market value that is determined by local assessors to be the total taxable value of land and additions on the property. | Land | Improvement |
|---|---|---|---|---|
| 2025 | $3,096 | $137,652 | $34,000 | $103,652 |
| 2024 | $2,837 | $125,592 | $32,000 | $93,592 |
| 2023 | $2,058 | $114,724 | $28,800 | $85,924 |
| 2022 | $2,093 | $90,544 | $24,000 | $66,544 |
| 2021 | $1,850 | $79,444 | $17,600 | $61,844 |
| 2020 | $1,850 | $79,444 | $17,600 | $61,844 |
| 2019 | $1,567 | $66,524 | $12,800 | $53,724 |
| 2018 | $1,567 | $66,524 | $12,800 | $53,724 |
| 2017 | $1,292 | $56,472 | $12,000 | $44,472 |
| 2016 | $1,294 | $56,472 | $12,000 | $44,472 |
| 2015 | $1,078 | $45,436 | $14,000 | $31,436 |
| 2014 | $1,087 | $45,436 | $0 | $0 |
Source: Public Records
Map
Nearby Homes
- 2423 Turtle Crossing NE
- 2256 Turtle Club Dr NE Unit 1
- 5100 Ravenwood Dr
- 255 Wild Ginger Bend
- 223 Wild Ginger Bend
- 235 Wild Ginger Bend
- 134 Sierra Cir
- 416 Maypop Ln
- 444 Maypop Ln
- 449 Maypop Ln
- 205 Leland Way
- 4709 Trickum Rd NE
- The Arlington Plan at Tanglewood
- The Alston A Plan at Tanglewood
- 461 Maypop Ln
- Bramwell Plan at Havencroft
- Hendricks Plan at Havencroft
- Wynstone Plan at Havencroft
- 4967 Turtle Summit NE
- 4971 Turtle Summit NE
- 0 Turtle Summit
- 4966 Turtle Summit NE
- 4965 Turtle Summit NE
- 4964 Turtle Summit NE
- 4970 Turtle Summit NE
- 4968 Turtle Summit NE
- 5019 Trickum Rd NE
- 4962 Turtle Summit NE Unit 2
- 4963 Turtle Summit NE
- 2431 Turtle Walk Ln
- 2430 Turtle Walk Ln Unit 2
- 0 Turtle Walk Ln Unit 3211856
- 0 Turtle Walk Ln
- 4977 Trickum Rd NE
- 4960 Turtle Summit NE
- 2432 Turtle Walk Ln
- 5021 Trickum Rd NE
- 4961 Turtle Summit NE