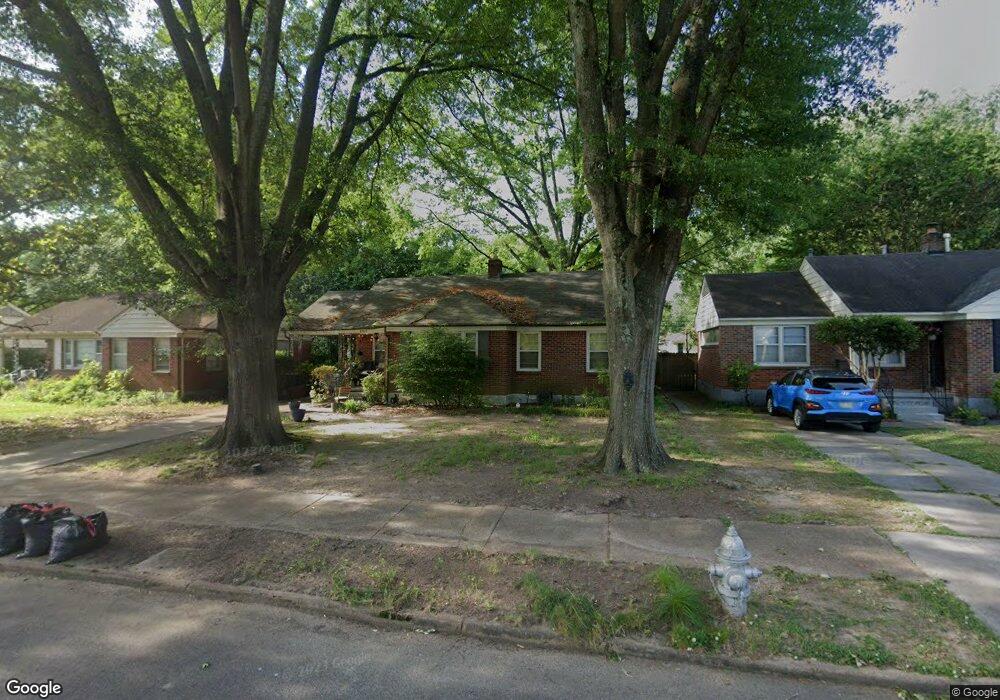
4969 Verosa Ave Memphis, TN 38117
Audubon Park NeighborhoodEstimated Value: $207,467 - $237,000
3
Beds
1
Bath
1,056
Sq Ft
$205/Sq Ft
Est. Value
About This Home
This home is located at 4969 Verosa Ave, Memphis, TN 38117 and is currently estimated at $216,367, approximately $204 per square foot. 4969 Verosa Ave is a home located in Shelby County with nearby schools including Richland Elementary School, White Station Middle, and White Station High.
Ownership History
Date
Name
Owned For
Owner Type
Purchase Details
Closed on
Apr 8, 2004
Sold by
Boler Christina O
Bought by
Sexton James G and Sexton Viretta Kay
Current Estimated Value
Home Financials for this Owner
Home Financials are based on the most recent Mortgage that was taken out on this home.
Original Mortgage
$61,000
Outstanding Balance
$28,465
Interest Rate
5.54%
Mortgage Type
Purchase Money Mortgage
Estimated Equity
$187,902
Purchase Details
Closed on
Nov 30, 2001
Sold by
Gay Christy Carole Garrett and Gay Kevin Michael
Bought by
Boler Christina O
Home Financials for this Owner
Home Financials are based on the most recent Mortgage that was taken out on this home.
Original Mortgage
$102,393
Interest Rate
6.6%
Mortgage Type
FHA
Purchase Details
Closed on
Nov 20, 1997
Sold by
Newsom Stephen K and Newsom Katherine Amy Hudson
Bought by
Garrett Christy Carole and Gay Kevin Michael
Home Financials for this Owner
Home Financials are based on the most recent Mortgage that was taken out on this home.
Original Mortgage
$71,575
Interest Rate
7.27%
Mortgage Type
FHA
Create a Home Valuation Report for This Property
The Home Valuation Report is an in-depth analysis detailing your home's value as well as a comparison with similar homes in the area
Home Values in the Area
Average Home Value in this Area
Purchase History
| Date | Buyer | Sale Price | Title Company |
|---|---|---|---|
| Sexton James G | $113,000 | -- | |
| Boler Christina O | $104,000 | -- | |
| Garrett Christy Carole | $80,000 | -- |
Source: Public Records
Mortgage History
| Date | Status | Borrower | Loan Amount |
|---|---|---|---|
| Open | Sexton James G | $61,000 | |
| Previous Owner | Boler Christina O | $102,393 | |
| Previous Owner | Garrett Christy Carole | $71,575 |
Source: Public Records
Tax History Compared to Growth
Tax History
| Year | Tax Paid | Tax Assessment Tax Assessment Total Assessment is a certain percentage of the fair market value that is determined by local assessors to be the total taxable value of land and additions on the property. | Land | Improvement |
|---|---|---|---|---|
| 2025 | $1,512 | $45,775 | $8,000 | $37,775 |
| 2024 | $1,512 | $44,600 | $8,000 | $36,600 |
| 2023 | $2,717 | $44,600 | $8,000 | $36,600 |
| 2022 | $2,717 | $44,600 | $8,000 | $36,600 |
| 2021 | $2,749 | $44,600 | $8,000 | $36,600 |
| 2020 | $2,536 | $35,000 | $6,775 | $28,225 |
| 2019 | $2,536 | $35,000 | $6,775 | $28,225 |
| 2018 | $2,536 | $35,000 | $6,775 | $28,225 |
| 2017 | $1,439 | $35,000 | $6,775 | $28,225 |
| 2016 | $1,227 | $28,075 | $0 | $0 |
| 2014 | $1,227 | $28,075 | $0 | $0 |
Source: Public Records
Map
Nearby Homes
- 4950 Princeton Rd
- 5009 Henry Heights Dr
- 5017 Henry Heights Dr
- 4931 Princeton Grove
- 416 Elwood Ln
- 5033 Henry Heights Dr
- 4865 Princeton Rd
- 4991 Shifri Ave
- 557 Sabine St Unit 557
- 352 Leonora Dr
- 346 Leonora Dr
- 4985 Chickasaw Rd
- 5121 Lynbar Ave
- 5119 Tarrytown Dr
- 352 Avon Rd
- 4737 Sequoia Rd
- 4730 Sequoia Rd
- 5137 Whitehall Ave
- 4980 Barfield Rd
- 209 Leonora Dr
- 4975 Verosa Ave
- 4963 Verosa Ave
- 4981 Verosa Ave
- 4957 Verosa Ave
- 4970 Sequoia Rd
- 4976 Sequoia Rd
- 4964 Sequoia Rd
- 4980 Sequoia Rd
- 4968 Verosa Ave
- 4958 Sequoia Rd
- 4987 Verosa Ave
- 4951 Verosa Ave
- 4962 Verosa Ave
- 4974 Verosa Ave
- 4956 Verosa Ave
- 4980 Verosa Ave
- 4986 Sequoia Rd
- 4952 Sequoia Rd
- 4993 Verosa Ave
- 4945 Verosa Ave