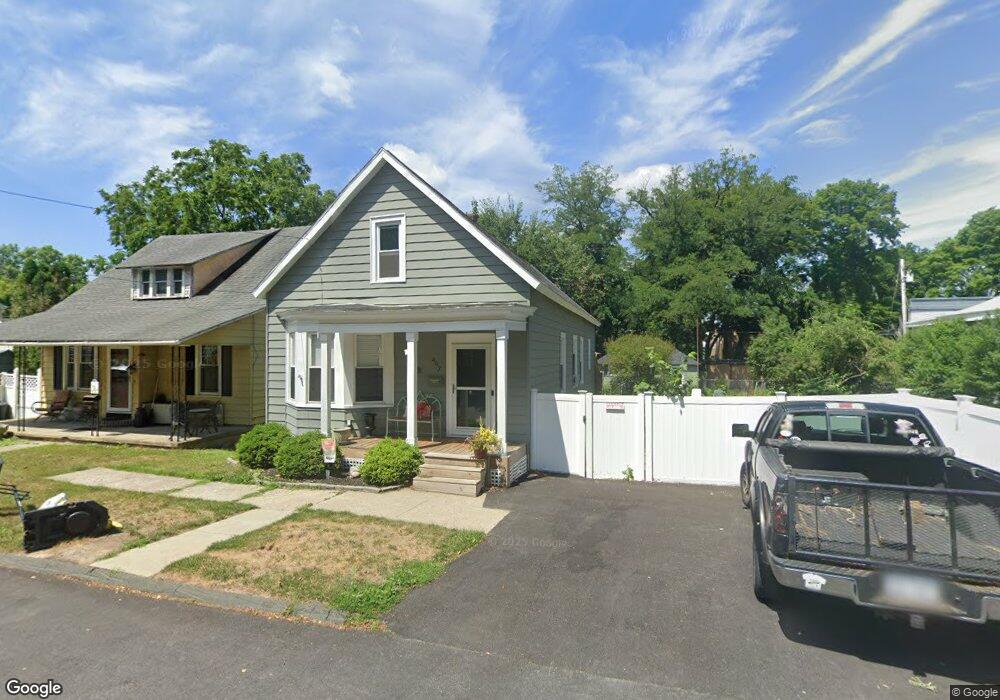
497 9th Ave Troy, NY 12182
Lansingburgh NeighborhoodEstimated Value: $153,000 - $216,000
3
Beds
1
Bath
1,158
Sq Ft
$152/Sq Ft
Est. Value
About This Home
This home is located at 497 9th Ave, Troy, NY 12182 and is currently estimated at $176,052, approximately $152 per square foot. 497 9th Ave is a home located in Rensselaer County with nearby schools including Turnpike Elementary School, Rensselaer Park Elementary School, and Knickerbacker Middle School.
Ownership History
Date
Name
Owned For
Owner Type
Purchase Details
Closed on
Sep 2, 2011
Sold by
Jensen Family Trust
Bought by
Carhide Zachary
Current Estimated Value
Home Financials for this Owner
Home Financials are based on the most recent Mortgage that was taken out on this home.
Original Mortgage
$99,179
Outstanding Balance
$68,691
Interest Rate
4.5%
Mortgage Type
FHA
Estimated Equity
$107,361
Purchase Details
Closed on
Mar 27, 2002
Create a Home Valuation Report for This Property
The Home Valuation Report is an in-depth analysis detailing your home's value as well as a comparison with similar homes in the area
Home Values in the Area
Average Home Value in this Area
Purchase History
| Date | Buyer | Sale Price | Title Company |
|---|---|---|---|
| Carhide Zachary | $101,760 | George R Slingerland | |
| -- | -- | -- |
Source: Public Records
Mortgage History
| Date | Status | Borrower | Loan Amount |
|---|---|---|---|
| Open | Carhide Zachary | $99,179 |
Source: Public Records
Tax History
| Year | Tax Paid | Tax Assessment Tax Assessment Total Assessment is a certain percentage of the fair market value that is determined by local assessors to be the total taxable value of land and additions on the property. | Land | Improvement |
|---|---|---|---|---|
| 2024 | $4,087 | $90,000 | $18,000 | $72,000 |
| 2023 | $4,050 | $90,000 | $18,000 | $72,000 |
| 2022 | $3,990 | $90,000 | $18,000 | $72,000 |
| 2021 | $1,634 | $90,000 | $18,000 | $72,000 |
| 2020 | $1,311 | $90,000 | $18,000 | $72,000 |
| 2019 | $2,263 | $90,000 | $18,000 | $72,000 |
| 2018 | $2,263 | $90,000 | $18,000 | $72,000 |
| 2017 | $2,223 | $90,000 | $18,000 | $72,000 |
| 2016 | $3,452 | $90,000 | $18,000 | $72,000 |
| 2015 | -- | $90,000 | $18,000 | $72,000 |
| 2014 | -- | $90,000 | $18,000 | $72,000 |
Source: Public Records
Map
Nearby Homes
Your Personal Tour Guide
Ask me questions while you tour the home.