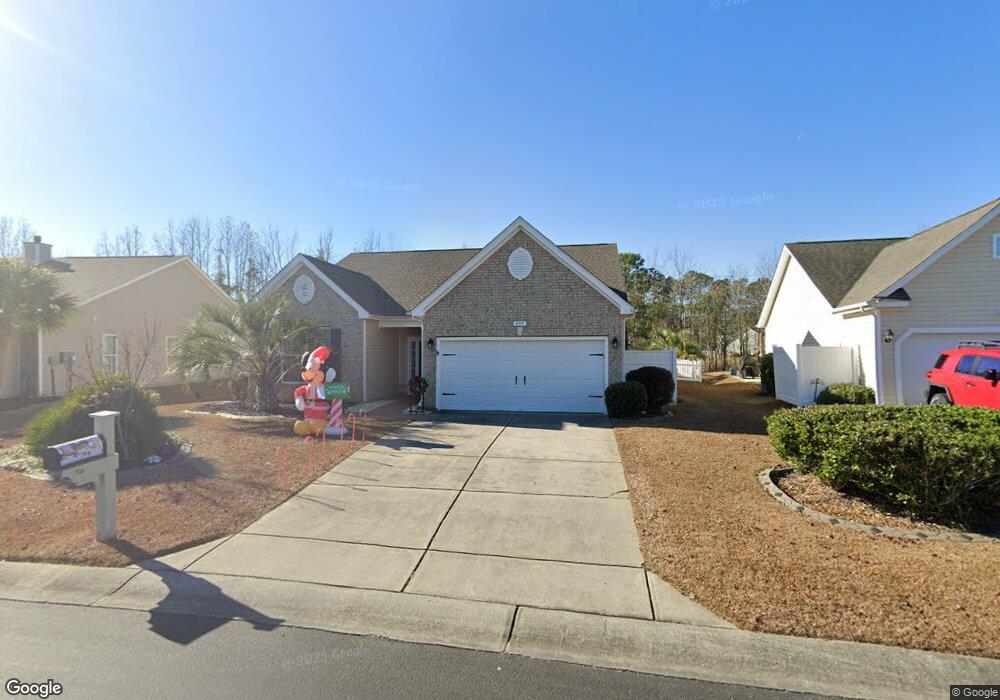
497 Slippery Rock Way Calabash, NC 28467
Estimated Value: $301,739 - $353,000
3
Beds
2
Baths
1,602
Sq Ft
$202/Sq Ft
Est. Value
About This Home
This home is located at 497 Slippery Rock Way, Calabash, NC 28467 and is currently estimated at $322,935, approximately $201 per square foot. 497 Slippery Rock Way is a home located in Brunswick County with nearby schools including Jessie Mae Monroe Elementary School, Shallotte Middle School, and West Brunswick High School.
Ownership History
Date
Name
Owned For
Owner Type
Purchase Details
Closed on
Jan 27, 2020
Sold by
Bertrand Charles G and Bertrand Maureen C
Bought by
Troxell Robert J and Troxell Kristine A
Current Estimated Value
Home Financials for this Owner
Home Financials are based on the most recent Mortgage that was taken out on this home.
Original Mortgage
$130,000
Outstanding Balance
$115,389
Interest Rate
3.73%
Mortgage Type
New Conventional
Estimated Equity
$207,546
Purchase Details
Closed on
Aug 31, 2015
Sold by
Savino Anthony V and Savino Colleen S
Bought by
The Bertrand Living Trust and Bertrand Maureen C
Home Financials for this Owner
Home Financials are based on the most recent Mortgage that was taken out on this home.
Original Mortgage
$133,600
Interest Rate
4.09%
Mortgage Type
New Conventional
Purchase Details
Closed on
Sep 27, 2007
Sold by
D R Horton Inc
Bought by
Savino Anthony and Savino Colleen S
Create a Home Valuation Report for This Property
The Home Valuation Report is an in-depth analysis detailing your home's value as well as a comparison with similar homes in the area
Home Values in the Area
Average Home Value in this Area
Purchase History
| Date | Buyer | Sale Price | Title Company |
|---|---|---|---|
| Troxell Robert J | $225,000 | None Available | |
| The Bertrand Living Trust | $167,000 | None Available | |
| Savino Anthony | $199,000 | None Available |
Source: Public Records
Mortgage History
| Date | Status | Borrower | Loan Amount |
|---|---|---|---|
| Open | Troxell Robert J | $130,000 | |
| Previous Owner | The Bertrand Living Trust | $133,600 |
Source: Public Records
Tax History Compared to Growth
Tax History
| Year | Tax Paid | Tax Assessment Tax Assessment Total Assessment is a certain percentage of the fair market value that is determined by local assessors to be the total taxable value of land and additions on the property. | Land | Improvement |
|---|---|---|---|---|
| 2025 | $1,520 | $298,620 | $40,000 | $258,620 |
| 2024 | $1,520 | $298,620 | $40,000 | $258,620 |
| 2023 | $1,309 | $298,620 | $40,000 | $258,620 |
| 2022 | $1,309 | $189,050 | $25,000 | $164,050 |
| 2021 | $1,309 | $189,050 | $25,000 | $164,050 |
| 2020 | $1,265 | $189,050 | $25,000 | $164,050 |
| 2019 | $1,265 | $26,890 | $25,000 | $1,890 |
| 2018 | $1,168 | $27,170 | $25,000 | $2,170 |
| 2017 | $1,168 | $27,170 | $25,000 | $2,170 |
| 2016 | $1,094 | $26,170 | $25,000 | $1,170 |
| 2015 | $1,094 | $169,420 | $25,000 | $144,420 |
| 2014 | $1,033 | $171,491 | $25,000 | $146,491 |
Source: Public Records
Map
Nearby Homes
- 498 Slippery Rock Way
- 504 Slippery Rock Way
- 470 Slippery Rock Way
- 465 Slippery Rock Way
- 94 Field Planters Cir Unit 94
- 94 Field Planters Cir
- 90 Field Planters Cir
- 3070 Crescent Lake Dr
- 1339 Sunny Slope Cir
- 7 Cattle Run Ln
- 73 Field Planters Cir Unit 73
- 73 Field Planters Cir
- 558 Tullimore Ln NW
- 19 Cattle Run Ln
- 1345 Sunny Slope Cir
- 850 Meadow Ln SW
- 1354 Fence Post Ln
- 3023 Cedar Creek Ln
- 1357 Sunny Slope Cir
- 111 Cobblers Cir
- 497 Slippery Rock Way
- 495 Slippery Rock Way Unit The Farm at Brunswic
- 499 Slippery Rock Way
- 499 Slippery Rock Way Unit LOT 512; PHASE 10
- 499 Slippery Rock Way Unit 512
- 493 Slippery Rock Way
- 498 Slippery Rock Way Unit Lot 465, Phase 10
- 498 Slippery Rock Way Unit 465
- 228 Downing Glen Place
- 496 Slippery Rock Way
- 491 Slippery Rock Way
- 491 Slippery Rock Way Unit LOT 508;PHASE 10
- 501 Slippery Rock Way
- 230 Downing Glen Place
- 230 Downing Glen Place
- 494 Slippery Rock Way - Eaton Model Unit THE FARM @ BRUNSWICK
- 494 Slippery Rock Way
- 494 Slippery Rock Way Unit THE FARM @ BRUNSWICK
- 489 Slippery Rock Way
- 492 Slippery Rock Way