
Estimated payment $2,520/month
Total Views
171
3
Beds
2
Baths
1,436
Sq Ft
$292
Price per Sq Ft
Highlights
- Fruit Trees
- No HOA
- Walk-In Closet
- Hydromassage or Jetted Bathtub
- Porch
- Tile Flooring
About This Home
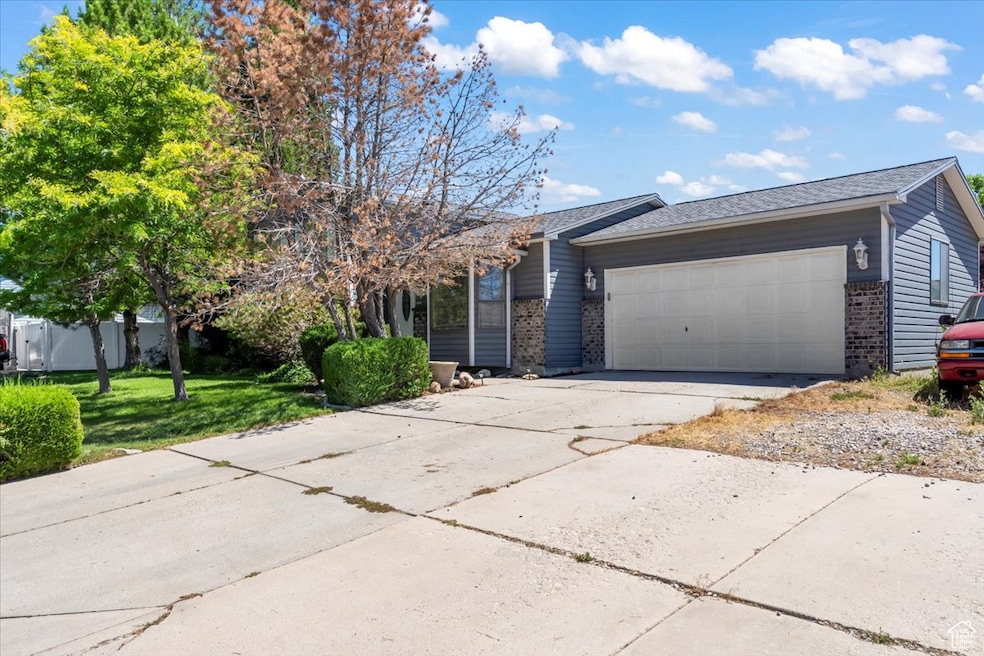
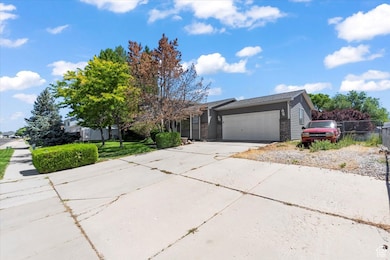
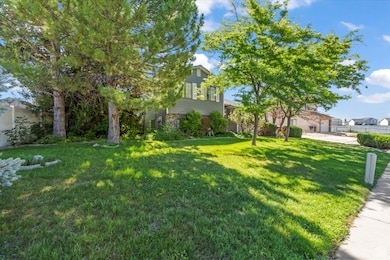
Located in the HEART of Roy this home is conveniently located near all major roadways, highway systems, Meadow Creek Pond and Walking Trails. Spacious rooms with tons of natural light and plenty of room for storage. Offering a large, fully fenced backyard with mature landscaping and fruit trees. Schedule your showing of this amazing home today!
Listing Agent
Markie Draper
Equity Real Estate (Select) License #9033538 Listed on: 07/14/2025
Home Details
Home Type
- Single Family
Est. Annual Taxes
- $2,400
Year Built
- Built in 1991
Lot Details
- 0.25 Acre Lot
- Property is Fully Fenced
- Landscaped
- Fruit Trees
- Mature Trees
- Property is zoned Single-Family
Parking
- 2 Car Garage
- 4 Open Parking Spaces
Home Design
- Split Level Home
- Brick Exterior Construction
- Asphalt
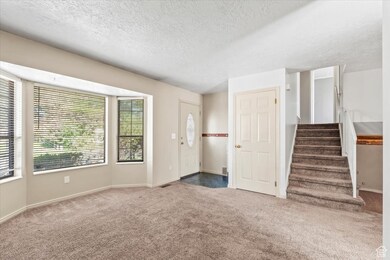
Interior Spaces
- 1,436 Sq Ft Home
- 3-Story Property
- Ceiling Fan
- Blinds
- Sliding Doors
- Free-Standing Range
Flooring
- Carpet
- Laminate
- Tile
Bedrooms and Bathrooms
- 3 Bedrooms
- Walk-In Closet
- Hydromassage or Jetted Bathtub
Basement
- Walk-Out Basement
- Exterior Basement Entry
Eco-Friendly Details
- Reclaimed Water Irrigation System
Outdoor Features
- Storage Shed
- Porch
Schools
- Country View Elementary School
- Rocky Mt Middle School
- Roy High School
Utilities
- Central Heating and Cooling System
- Natural Gas Connected
Community Details
- No Home Owners Association
- Countrybrook Subdivision
Listing and Financial Details
- Assessor Parcel Number 09-289-0010
Map
Create a Home Valuation Report for This Property
The Home Valuation Report is an in-depth analysis detailing your home's value as well as a comparison with similar homes in the area
Home Values in the Area
Average Home Value in this Area
Tax History
| Year | Tax Paid | Tax Assessment Tax Assessment Total Assessment is a certain percentage of the fair market value that is determined by local assessors to be the total taxable value of land and additions on the property. | Land | Improvement |
|---|---|---|---|---|
| 2024 | $2,359 | $204,599 | $75,034 | $129,565 |
| 2023 | $2,426 | $212,300 | $68,648 | $143,652 |
| 2022 | $2,530 | $228,800 | $61,518 | $167,282 |
| 2021 | $2,011 | $297,000 | $85,054 | $211,946 |
| 2020 | $1,967 | $268,000 | $85,054 | $182,946 |
| 2019 | $1,804 | $230,000 | $49,060 | $180,940 |
| 2018 | $1,682 | $201,000 | $45,109 | $155,891 |
| 2017 | $1,450 | $160,000 | $45,109 | $114,891 |
| 2016 | $1,414 | $83,954 | $23,493 | $60,461 |
| 2015 | $1,262 | $76,499 | $23,493 | $53,006 |
| 2014 | $1,178 | $69,871 | $20,706 | $49,165 |
Source: Public Records
Property History
| Date | Event | Price | Change | Sq Ft Price |
|---|---|---|---|---|
| 07/14/2025 07/14/25 | For Sale | $420,000 | -- | $292 / Sq Ft |
Source: UtahRealEstate.com
Purchase History
| Date | Type | Sale Price | Title Company |
|---|---|---|---|
| Interfamily Deed Transfer | -- | None Available | |
| Quit Claim Deed | -- | Surety Title |
Source: Public Records
Mortgage History
| Date | Status | Loan Amount | Loan Type |
|---|---|---|---|
| Open | $30,000 | Credit Line Revolving | |
| Open | $127,200 | Unknown | |
| Closed | $15,900 | Stand Alone Second | |
| Closed | $9,200 | Unknown | |
| Closed | $115,324 | Purchase Money Mortgage |
Source: Public Records
Similar Homes in Roy, UT
Source: UtahRealEstate.com
MLS Number: 2098517
APN: 09-289-0010
Disclaimer: Certain information contained herein is derived from information provided by parties other than Homes.com. All information provided is deemed reliable, but is not guaranteed to be accurate and should be independently verified.
![]() IDX information is provided exclusively for consumers’ personal, non-commercial use, that it may not be used for any purpose other than to identify prospective properties consumers may be interested in purchasing, and that the data is deemed reliable but is not guaranteed accurate by the MLS. Licensor is only providing the MLS Content and not other sources of data provided in the Product.
IDX information is provided exclusively for consumers’ personal, non-commercial use, that it may not be used for any purpose other than to identify prospective properties consumers may be interested in purchasing, and that the data is deemed reliable but is not guaranteed accurate by the MLS. Licensor is only providing the MLS Content and not other sources of data provided in the Product.
Based on information from the Wasatch Front Regional Multiple Listing Service, Inc.. All data, including all measurements and calculations of area, is obtained from various sources and has not been, and will not be, verified by broker or the MLS. All information should be independently reviewed and verified for accuracy. Properties may or may not be listed by the office/agent presenting the information.
Nearby Homes
- 3910 W 4800 S
- 3948 W 5325 S
- 4651 S 3950 W
- 3871 W 5075 S
- 4600 S 3500 W
- 2953 W 4850 S
- 4949 S 2925 W
- 3027 W 4375 S
- 3330 W 4000 S
- 5549 S 2700 W
- 5549 S 2700 W Unit room 2
- 5258 W 3750 S
- 4389 S Locomotive Dr
- 2413 W 1915 N
- 2679 N 950 W
- 2601 W 1630 N
- 1652 N 2275 W
- 2405 Hinckley Dr
- 4499 S 1930 W
- 5000 S 1900 W