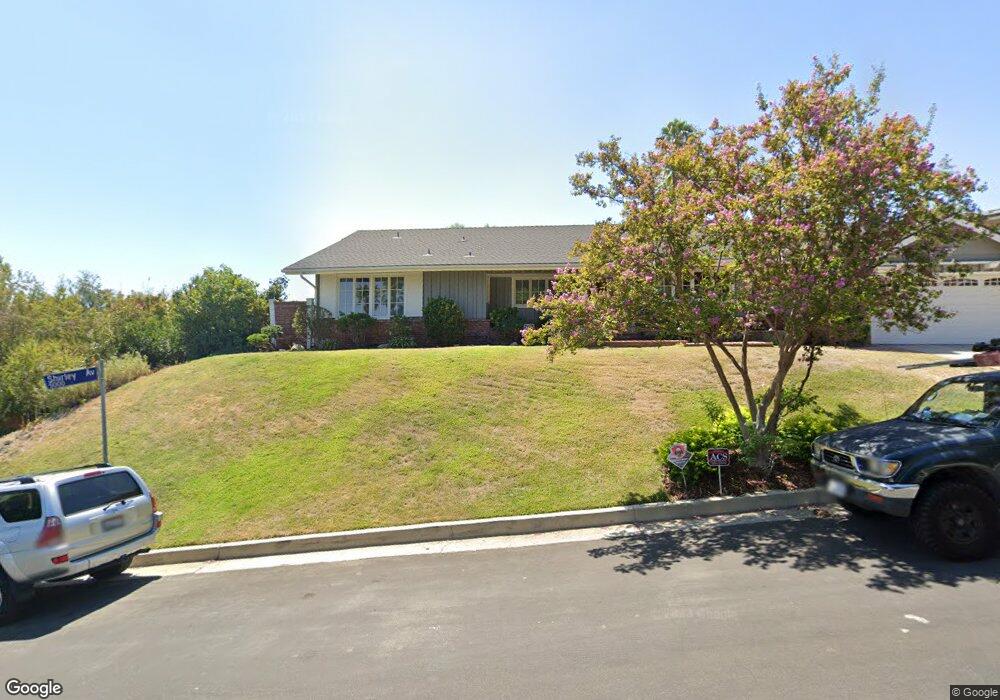
4972 Calvin Ave Tarzana, CA 91356
Estimated Value: $1,984,000 - $2,463,000
4
Beds
3
Baths
2,478
Sq Ft
$877/Sq Ft
Est. Value
About This Home
This home is located at 4972 Calvin Ave, Tarzana, CA 91356 and is currently estimated at $2,173,548, approximately $877 per square foot. 4972 Calvin Ave is a home located in Los Angeles County with nearby schools including Gaspar De Portola Middle School, CHIME Institute's Schwarzenegger Community, and Wilbur Charter For Enriched Academics.
Ownership History
Date
Name
Owned For
Owner Type
Purchase Details
Closed on
Jun 14, 2007
Sold by
Lambert Brian Drew and Lambert Allison Nichole
Bought by
Lambert Brian D and Lambert Allison
Current Estimated Value
Purchase Details
Closed on
Aug 22, 2006
Sold by
Pease Scott and Pease Ashley
Bought by
Lambert Brian Drew and Lambert Allison Nichole
Home Financials for this Owner
Home Financials are based on the most recent Mortgage that was taken out on this home.
Original Mortgage
$912,000
Outstanding Balance
$541,577
Interest Rate
6.56%
Mortgage Type
Purchase Money Mortgage
Estimated Equity
$1,631,971
Purchase Details
Closed on
Sep 5, 2001
Sold by
Lewis Orna
Bought by
Pease Scott and Pease Ashley
Home Financials for this Owner
Home Financials are based on the most recent Mortgage that was taken out on this home.
Original Mortgage
$508,000
Interest Rate
6.88%
Purchase Details
Closed on
Jan 20, 1998
Sold by
Bailey George W and Bailey Eleanor J
Bought by
Lewis Orna
Create a Home Valuation Report for This Property
The Home Valuation Report is an in-depth analysis detailing your home's value as well as a comparison with similar homes in the area
Home Values in the Area
Average Home Value in this Area
Purchase History
| Date | Buyer | Sale Price | Title Company |
|---|---|---|---|
| Lambert Brian D | -- | None Available | |
| Lambert Brian Drew | $1,140,000 | Fatcola | |
| Pease Scott | $635,000 | Equity Title | |
| Lewis Orna | $400,000 | Equity Title |
Source: Public Records
Mortgage History
| Date | Status | Borrower | Loan Amount |
|---|---|---|---|
| Open | Lambert Brian Drew | $912,000 | |
| Previous Owner | Pease Scott | $508,000 |
Source: Public Records
Tax History Compared to Growth
Tax History
| Year | Tax Paid | Tax Assessment Tax Assessment Total Assessment is a certain percentage of the fair market value that is determined by local assessors to be the total taxable value of land and additions on the property. | Land | Improvement |
|---|---|---|---|---|
| 2025 | $18,524 | $1,527,344 | $1,221,881 | $305,463 |
| 2024 | $18,524 | $1,497,397 | $1,197,923 | $299,474 |
| 2023 | $18,168 | $1,468,037 | $1,174,435 | $293,602 |
| 2022 | $17,349 | $1,439,253 | $1,151,407 | $287,846 |
| 2021 | $16,938 | $1,394,000 | $1,115,000 | $279,000 |
| 2019 | $15,313 | $1,257,000 | $1,005,400 | $251,600 |
| 2018 | $14,082 | $1,144,000 | $915,000 | $229,000 |
| 2016 | $12,238 | $998,000 | $798,000 | $200,000 |
| 2015 | $12,240 | $998,000 | $798,000 | $200,000 |
| 2014 | $12,520 | $998,000 | $798,000 | $200,000 |
Source: Public Records
Map
Nearby Homes
- 4905 Palo Dr
- 5020 Bilmoor Ave
- 19536 Wells Dr
- 19554 Wells Dr
- 4745 Caritina Dr
- 19631 Rosita St
- 4950 Vanalden Ave
- 4918 Calvin Ave
- 19333 Wells Dr
- 4900 Queen Victoria Rd
- 4755 Vanalden Ave
- 4835 Corbin Ave
- 4851 Corbin Ave
- 19633 Wells Dr
- 5220 Melvin Ave
- 4830 Hasekian Dr
- 4653 Vanalden Ave
- 19715 Komar Dr
- 5234 Tampa Ave
- 5200 Collier Place
- 4968 Calvin Ave
- 5000 Calvin Ave
- 4964 Calvin Ave
- 5004 Calvin Ave
- 4961 Calvin Ave
- 4965 Calvin Ave
- 4956 Calvin Ave
- 5000 Shirley Ave
- 4960 Calvin Ave
- 4957 Calvin Ave
- 5010 Calvin Ave
- 19405 Bilmoor Place
- 4952 Calvin Ave
- 4969 Palo Dr
- 5012 Shirley Ave
- 5013 Calvin Ave
- 5013 Shirley Ave
- 19409 Bilmoor Place
- 4953 Calvin Ave
- 4911 Palo Dr