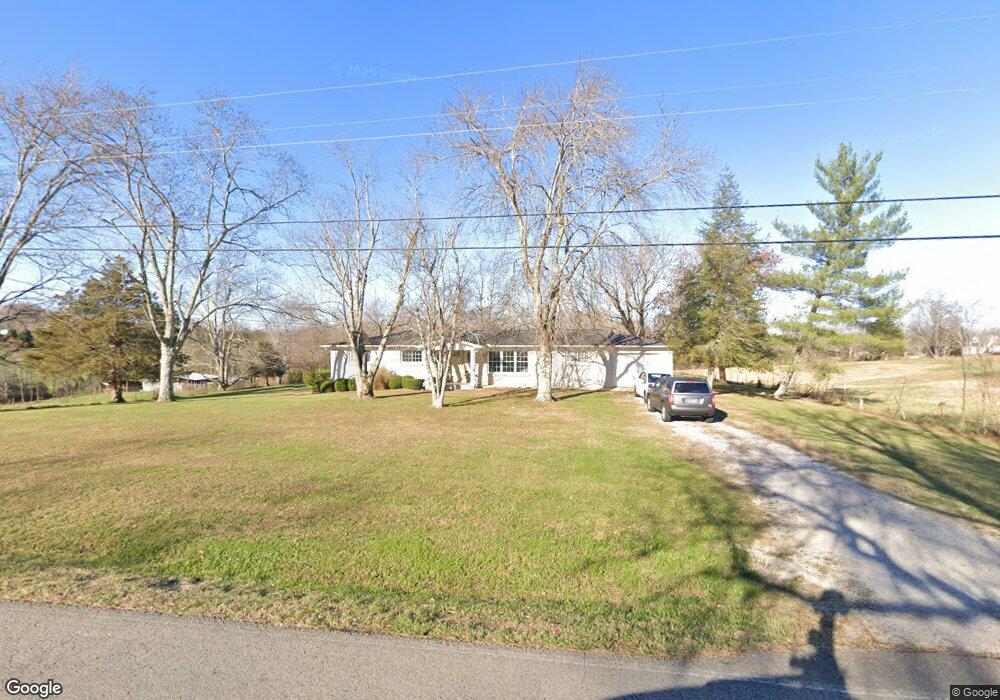
4974 Mirandy Rd Cookeville, TN 38506
Estimated Value: $229,245 - $347,000
3
Beds
2
Baths
1,560
Sq Ft
$188/Sq Ft
Est. Value
About This Home
This home is located at 4974 Mirandy Rd, Cookeville, TN 38506 and is currently estimated at $292,811, approximately $187 per square foot. 4974 Mirandy Rd is a home located in Putnam County with nearby schools including Algood Middle School, Algood Elementary School, and Cookeville High School.
Ownership History
Date
Name
Owned For
Owner Type
Purchase Details
Closed on
Jul 3, 2008
Sold by
Carter Bobby L
Bought by
John Heard Bruce
Current Estimated Value
Home Financials for this Owner
Home Financials are based on the most recent Mortgage that was taken out on this home.
Original Mortgage
$129,960
Outstanding Balance
$83,671
Interest Rate
6.03%
Estimated Equity
$209,140
Purchase Details
Closed on
May 10, 2007
Sold by
Veterans Affairs
Bought by
Carter Bobby L and Carter Susan C
Purchase Details
Closed on
Oct 12, 2006
Sold by
Wolfer Donald L and Wolfer Audrey I
Bought by
Veterans Affairs
Purchase Details
Closed on
Nov 5, 1998
Sold by
Dishman Raymond C
Bought by
Wolfer Donald L
Home Financials for this Owner
Home Financials are based on the most recent Mortgage that was taken out on this home.
Original Mortgage
$79,560
Interest Rate
6.58%
Purchase Details
Closed on
Oct 25, 1983
Bought by
Dishman Raymond C
Create a Home Valuation Report for This Property
The Home Valuation Report is an in-depth analysis detailing your home's value as well as a comparison with similar homes in the area
Home Values in the Area
Average Home Value in this Area
Purchase History
| Date | Buyer | Sale Price | Title Company |
|---|---|---|---|
| John Heard Bruce | $132,000 | -- | |
| Carter Bobby L | $75,000 | -- | |
| Veterans Affairs | $73,148 | -- | |
| Wolfer Donald L | $78,000 | -- | |
| Dishman Raymond C | -- | -- |
Source: Public Records
Mortgage History
| Date | Status | Borrower | Loan Amount |
|---|---|---|---|
| Open | Dishman Raymond C | $129,960 | |
| Previous Owner | Dishman Raymond C | $79,560 |
Source: Public Records
Tax History Compared to Growth
Tax History
| Year | Tax Paid | Tax Assessment Tax Assessment Total Assessment is a certain percentage of the fair market value that is determined by local assessors to be the total taxable value of land and additions on the property. | Land | Improvement |
|---|---|---|---|---|
| 2024 | $823 | $30,925 | $4,025 | $26,900 |
| 2023 | $823 | $30,925 | $4,025 | $26,900 |
| 2022 | $764 | $30,925 | $4,025 | $26,900 |
| 2021 | $764 | $30,925 | $4,025 | $26,900 |
| 2020 | $625 | $30,925 | $4,025 | $26,900 |
| 2019 | $625 | $21,375 | $3,525 | $17,850 |
| 2018 | $584 | $21,375 | $3,525 | $17,850 |
| 2017 | $584 | $21,375 | $3,525 | $17,850 |
| 2016 | $584 | $21,375 | $3,525 | $17,850 |
| 2015 | $600 | $21,375 | $3,525 | $17,850 |
| 2014 | $593 | $21,128 | $0 | $0 |
Source: Public Records
Map
Nearby Homes
- 1916 Bear Creek Point
- 2035 Bear Creek Point
- 4201 Mirandy Rd
- 3006 Deerhaven Dr N
- 3435 Northwind Dr
- 2908 Deerhaven Dr S
- 000 Mirandy Rd
- 3429 Wj Robinson Rd
- 3485 Officers Chapel Rd
- 1663 Paran Rd
- 0 Bear Creek Cir
- 3930 Olyvia Ct
- 3011 Zeb Warren Rd
- 902 Evelyn Ct
- 5004 Curtis Way
- 1081 Cynthia St
- 5898 Hilham Rd
- 3354 Dogwood Ln
- 4887 Hilham Rd
- 4920 Mirandy Rd
- 5026 Mirandy Rd
- 4871 Mirandy Rd
- 5052 Mirandy Rd
- 12 Acres Brangus Ln
- 2950 Brangus Ln
- 5205 Mirandy Rd
- 3077 Brangus Ln
- 2802 Brangus Ln
- 4701 Mirandy Rd
- 2985 Brangus Ln
- 3099 Mirandy Rd
- 4659 Mirandy Rd
- 2790 Brangus Ln
- 2900 Brangus Ln
- 4660 Mirandy Rd
- 5297 Mirandy Rd
- 2835 Paran Pointe Dr
- 2735 Beckner Ln
- 2841 Paran Pointe Dr