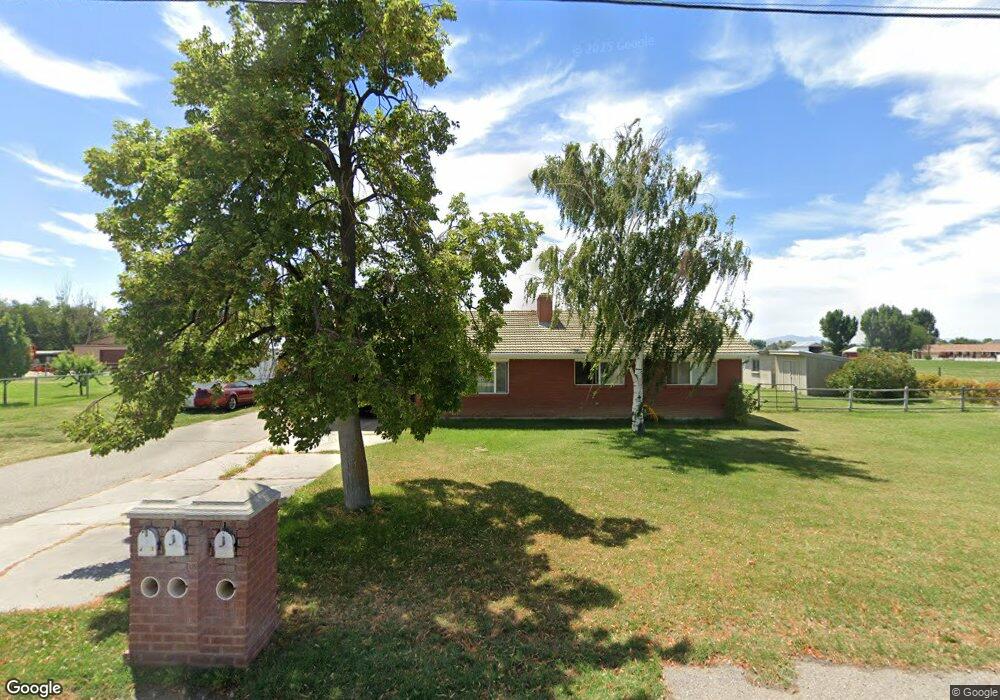
4975 S 6300 W Hooper, UT 84315
Estimated Value: $487,239 - $561,000
3
Beds
2
Baths
1,244
Sq Ft
$418/Sq Ft
Est. Value
About This Home
This home is located at 4975 S 6300 W, Hooper, UT 84315 and is currently estimated at $519,560, approximately $417 per square foot. 4975 S 6300 W is a home located in Weber County with nearby schools including Hooper Elementary School, Rocky Mountain Junior High School, and Fremont High School.
Ownership History
Date
Name
Owned For
Owner Type
Purchase Details
Closed on
Oct 28, 2003
Sold by
Wolford Benjamin J
Bought by
Pennington Mark
Current Estimated Value
Home Financials for this Owner
Home Financials are based on the most recent Mortgage that was taken out on this home.
Original Mortgage
$135,867
Outstanding Balance
$62,901
Interest Rate
5.98%
Mortgage Type
FHA
Estimated Equity
$456,659
Purchase Details
Closed on
Oct 27, 2003
Sold by
Bills Kent L and Bills Anne C
Bought by
Wolford Benjamin J
Home Financials for this Owner
Home Financials are based on the most recent Mortgage that was taken out on this home.
Original Mortgage
$135,867
Outstanding Balance
$62,901
Interest Rate
5.98%
Mortgage Type
FHA
Estimated Equity
$456,659
Purchase Details
Closed on
Feb 15, 2002
Sold by
Koz Construction Inc
Bought by
Wolford Benjamin J and Bills Kent L
Home Financials for this Owner
Home Financials are based on the most recent Mortgage that was taken out on this home.
Original Mortgage
$130,173
Interest Rate
7.04%
Mortgage Type
FHA
Purchase Details
Closed on
Jun 25, 2001
Sold by
Young Kelly R and Young Shaunda J
Bought by
Koz Construction Inc
Create a Home Valuation Report for This Property
The Home Valuation Report is an in-depth analysis detailing your home's value as well as a comparison with similar homes in the area
Home Values in the Area
Average Home Value in this Area
Purchase History
| Date | Buyer | Sale Price | Title Company |
|---|---|---|---|
| Pennington Mark | -- | Mountain View Title | |
| Wolford Benjamin J | -- | Mountain View Title | |
| Wolford Benjamin J | -- | Mountain View Title | |
| Koz Construction Inc | -- | Mountain View Title |
Source: Public Records
Mortgage History
| Date | Status | Borrower | Loan Amount |
|---|---|---|---|
| Open | Pennington Mark | $135,867 | |
| Previous Owner | Wolford Benjamin J | $130,173 |
Source: Public Records
Tax History Compared to Growth
Tax History
| Year | Tax Paid | Tax Assessment Tax Assessment Total Assessment is a certain percentage of the fair market value that is determined by local assessors to be the total taxable value of land and additions on the property. | Land | Improvement |
|---|---|---|---|---|
| 2025 | $2,508 | $424,301 | $173,591 | $250,710 |
| 2024 | $2,408 | $235,189 | $95,475 | $139,714 |
| 2023 | $2,370 | $229,382 | $92,877 | $136,505 |
| 2022 | $2,392 | $229,900 | $76,222 | $153,678 |
| 2021 | $1,882 | $303,999 | $105,377 | $198,622 |
| 2020 | $1,790 | $264,000 | $69,469 | $194,531 |
| 2019 | $1,681 | $236,000 | $52,160 | $183,840 |
| 2018 | $1,501 | $202,001 | $47,024 | $154,977 |
| 2017 | $1,380 | $179,000 | $47,015 | $131,985 |
| 2016 | $1,374 | $99,328 | $26,894 | $72,434 |
| 2015 | $1,297 | $92,402 | $23,418 | $68,984 |
| 2014 | $1,285 | $89,057 | $28,544 | $60,513 |
Source: Public Records
Map
Nearby Homes
- 6036 W 4700 S
- 6014 W 5300 S
- 6360 W 5500 S
- 0 W 5500 S
- 3729 S 5600 W Unit 6
- 3720 S 5600 W Unit 2
- 3719 S 5600 W Unit 7
- 4146 S 5800 W Unit 5
- 4163 S 5800 W Unit 2
- 5319 S 7100 W
- 5335 W 5500 S
- 5801 S 7100 W
- 3632 S 5400 W
- 5752 W 2425 N
- 4100 S 5900 W
- 4879 S 5050 W
- 4111 S 5350 W
- 3191 S 5100 St W Unit 1
- 3706 S 5650 W Unit 9
- 3691 S 5600 W Unit 20