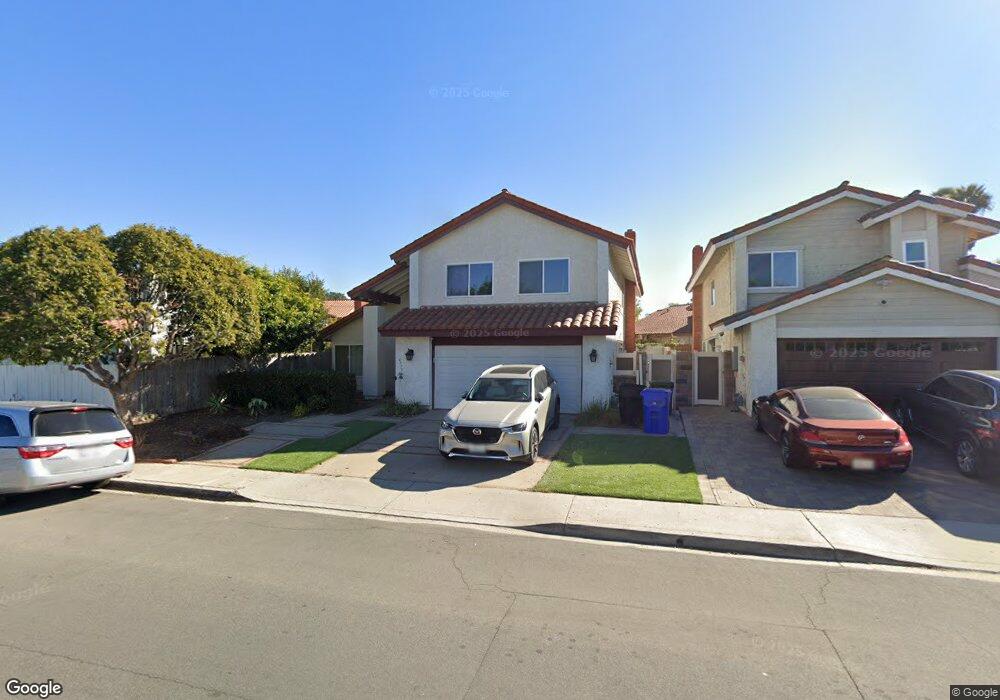
4975 Via Lapiz San Diego, CA 92122
University City NeighborhoodEstimated Value: $1,689,461 - $1,905,000
4
Beds
3
Baths
2,581
Sq Ft
$693/Sq Ft
Est. Value
About This Home
This home is located at 4975 Via Lapiz, San Diego, CA 92122 and is currently estimated at $1,789,365, approximately $693 per square foot. 4975 Via Lapiz is a home located in San Diego County with nearby schools including Marie Curie Elementary School, Standley Middle School, and University City High School.
Ownership History
Date
Name
Owned For
Owner Type
Purchase Details
Closed on
Feb 15, 2024
Sold by
Blacksbery Layah
Bought by
Blacksbery David
Current Estimated Value
Purchase Details
Closed on
Jun 9, 2016
Sold by
Chen Chien Huei and Lu Chiao Yu
Bought by
Blacksberg David and Blacksberg Layah
Home Financials for this Owner
Home Financials are based on the most recent Mortgage that was taken out on this home.
Original Mortgage
$630,375
Interest Rate
3.57%
Mortgage Type
New Conventional
Purchase Details
Closed on
Jun 7, 2015
Sold by
Chen Chien Huei and Lu Chiao Yu
Bought by
The Chen & Lu Family Trust and Lu Chiao Yu
Purchase Details
Closed on
Jun 7, 2010
Sold by
Kuo Wei Llc
Bought by
Chen Chien Huei and Lu Chiao Yu
Purchase Details
Closed on
Jul 26, 2007
Sold by
Boas Donald P and Boas Fu Ping Yu
Bought by
Kuo Wei Llc
Purchase Details
Closed on
Sep 30, 1986
Create a Home Valuation Report for This Property
The Home Valuation Report is an in-depth analysis detailing your home's value as well as a comparison with similar homes in the area
Home Values in the Area
Average Home Value in this Area
Purchase History
| Date | Buyer | Sale Price | Title Company |
|---|---|---|---|
| Blacksbery David | -- | None Listed On Document | |
| Blacksberg David | $840,500 | Lawyers Title | |
| The Chen & Lu Family Trust | -- | None Available | |
| Chen Chien Huei | $780,000 | The Heritage Escrow Company | |
| Kuo Wei Llc | -- | None Available | |
| -- | $225,000 | -- |
Source: Public Records
Mortgage History
| Date | Status | Borrower | Loan Amount |
|---|---|---|---|
| Previous Owner | Blacksberg David | $630,375 |
Source: Public Records
Tax History Compared to Growth
Tax History
| Year | Tax Paid | Tax Assessment Tax Assessment Total Assessment is a certain percentage of the fair market value that is determined by local assessors to be the total taxable value of land and additions on the property. | Land | Improvement |
|---|---|---|---|---|
| 2025 | $11,928 | $994,972 | $523,669 | $471,303 |
| 2024 | $11,928 | $975,463 | $513,401 | $462,062 |
| 2023 | $11,664 | $956,337 | $503,335 | $453,002 |
| 2022 | $11,352 | $937,586 | $493,466 | $444,120 |
| 2021 | $11,273 | $919,203 | $483,791 | $435,412 |
| 2020 | $11,135 | $909,779 | $478,831 | $430,948 |
| 2019 | $10,935 | $891,942 | $469,443 | $422,499 |
| 2018 | $10,222 | $874,454 | $460,239 | $414,215 |
| 2017 | $9,977 | $857,309 | $451,215 | $406,094 |
| 2016 | $9,688 | $822,514 | $432,902 | $389,612 |
| 2015 | $9,546 | $810,160 | $426,400 | $383,760 |
| 2014 | -- | $794,291 | $418,048 | $376,243 |
Source: Public Records
Map
Nearby Homes
- 4612 Benhurst Ave
- 7212 Florey St
- 7056 Haworth St
- 4635 Pauling Ave
- 4627 Huggins St
- 4224 Governor Dr
- 4495 Cather Ave
- 5448 Noah Way
- 5889 Cozzens St
- 6214 Agee St Unit 34
- 5266 Diane Ave
- 7190 Shoreline Dr Unit 6313
- 6188 Agee St Unit 230
- 6190 Agee St Unit 260
- 5191 Millwood Rd
- 7160 Shoreline Dr Unit 4213
- 6330 Genesee Ave Unit 319
- 6330 Genesee Ave Unit 220
- 6330 Genesee Ave Unit 119
- 6330 Genesee Ave Unit 112
- 4955 Via Lapiz
- 6294 Lakewood St
- 4976 Corlita Ct
- 6288 Lakewood St
- 4966 Corlita Ct
- 4938 Via Lapiz
- 4936 Via Lapiz
- 6282 Lakewood St
- 4915 Via Lapiz
- 4932 Via Lapiz
- 4934 Via Lapiz
- 4916 Via Lapiz
- 6285 Via Regla
- 4914 Via Lapiz Unit 2
- 4912 Via Lapiz Unit 1
- 4955 Corlita Ct
- 6276 Lakewood St
- 6277 Via Regla
- 4944 Via Lapiz
- 4948 Via Lapiz Unit 12