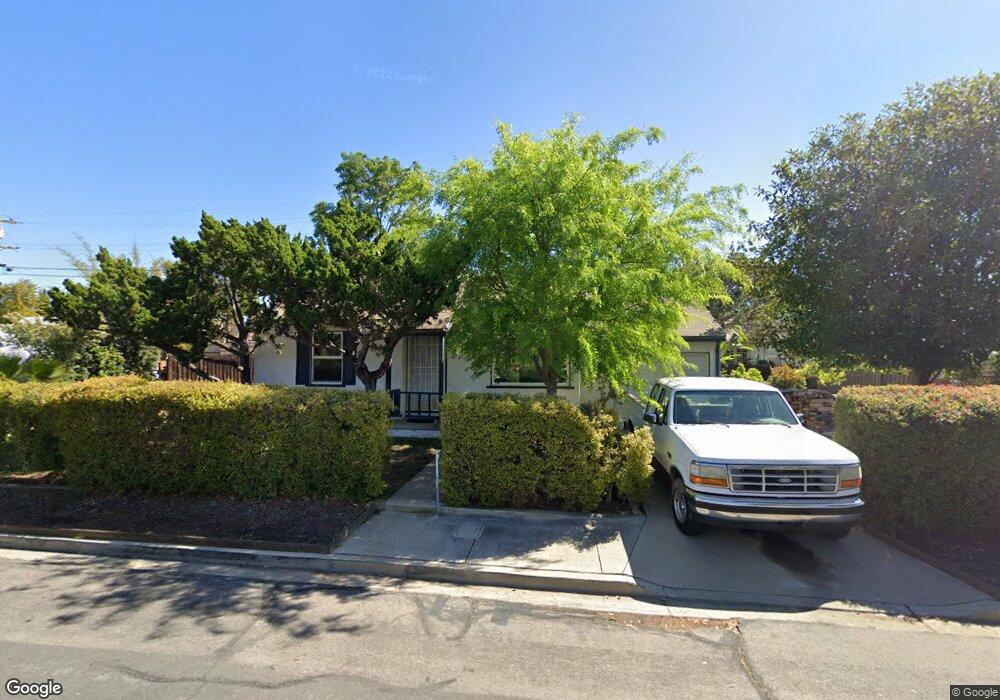
4979 Porter Hill Rd La Mesa, CA 91942
Estimated Value: $713,854 - $912,000
2
Beds
1
Bath
706
Sq Ft
$1,130/Sq Ft
Est. Value
About This Home
This home is located at 4979 Porter Hill Rd, La Mesa, CA 91942 and is currently estimated at $797,464, approximately $1,129 per square foot. 4979 Porter Hill Rd is a home located in San Diego County with nearby schools including Lemon Avenue Elementary School, La Mesa Arts Academy, and Grossmont High School.
Ownership History
Date
Name
Owned For
Owner Type
Purchase Details
Closed on
May 23, 2014
Sold by
Maxwell Craig Stephen and Maxwell Lynn Meineke
Bought by
Maxwell Craig S and Maxwell Fred L
Current Estimated Value
Home Financials for this Owner
Home Financials are based on the most recent Mortgage that was taken out on this home.
Original Mortgage
$225,000
Outstanding Balance
$170,833
Interest Rate
4.23%
Mortgage Type
New Conventional
Estimated Equity
$626,631
Purchase Details
Closed on
Feb 23, 1998
Sold by
Clarence Dretzke and Clarence Ellen E
Bought by
Maxwell Craig Stephen and Maxwell Lynn Meineke
Home Financials for this Owner
Home Financials are based on the most recent Mortgage that was taken out on this home.
Original Mortgage
$114,400
Interest Rate
7.18%
Create a Home Valuation Report for This Property
The Home Valuation Report is an in-depth analysis detailing your home's value as well as a comparison with similar homes in the area
Purchase History
| Date | Buyer | Sale Price | Title Company |
|---|---|---|---|
| Maxwell Craig S | -- | Ticor Title Company | |
| Maxwell Craig S | -- | Ticor Title Company | |
| Maxwell Craig Stephen | $143,000 | Commonwealth Land Title Co |
Source: Public Records
Mortgage History
| Date | Status | Borrower | Loan Amount |
|---|---|---|---|
| Open | Maxwell Craig S | $225,000 | |
| Previous Owner | Maxwell Craig Stephen | $114,400 |
Source: Public Records
Tax History
| Year | Tax Paid | Tax Assessment Tax Assessment Total Assessment is a certain percentage of the fair market value that is determined by local assessors to be the total taxable value of land and additions on the property. | Land | Improvement |
|---|---|---|---|---|
| 2025 | $3,926 | $298,029 | $177,898 | $120,131 |
| 2024 | $3,926 | $292,186 | $174,410 | $117,776 |
| 2023 | $3,752 | $286,458 | $170,991 | $115,467 |
| 2022 | $3,693 | $280,842 | $167,639 | $113,203 |
| 2021 | $3,624 | $275,336 | $164,352 | $110,984 |
| 2020 | $3,511 | $272,513 | $162,667 | $109,846 |
| 2019 | $3,446 | $267,171 | $159,478 | $107,693 |
| 2018 | $3,399 | $261,933 | $156,351 | $105,582 |
| 2017 | $50 | $256,798 | $153,286 | $103,512 |
| 2016 | $3,239 | $251,764 | $150,281 | $101,483 |
| 2015 | $3,219 | $247,983 | $148,024 | $99,959 |
| 2014 | $2,488 | $186,253 | $130,251 | $56,002 |
Source: Public Records
Map
Nearby Homes
- 4900 Rosehedge Dr Unit 208
- 4869-71 Pine St
- 8860 Madison Ave
- 8648 Alpine Ave
- 8587 Alpine Ave
- 8745 Glenira Ave
- 8870-78 La Mesa Blvd
- 4701 Date Ave Unit 219
- 8150 Lemon Ave Unit 222
- 8220 Vincetta Dr Unit 26
- 8615 Mariposa St
- 5055 Bancroft Dr
- 8260-62 Pasadena Ave
- 4515 Acacia Ave
- 4416 Palm Ave Unit 12
- 8000 University Ave Unit 202
- 4935 Clearview Way
- 7932-40 La Mesa Blvd
- 4388 Bellflower Dr
- 5410 Bishops Way
- 4965 Porter Hill Rd
- 4989 Porter Hill Rd
- 8558 Roach Dr
- 8540 Roach Dr
- 4990 Porter Hill Rd
- 4992 Porter Hill Rd
- 8501 Victory Rd
- 8511 Victory Rd
- 8500 Roach Dr
- 8560 Roach Dr
- 8551 Roach Dr
- 8521 Victory Rd
- 4994 Porter Hill Rd
- 8557 Roach Dr
- 4970 Porter Hill Rd
- 8541 Roach Dr
- 8531 Victory Rd
- 4996 Porter Hill Rd
- 4960 Porter Hill Rd
- 8531 Roach Dr
Your Personal Tour Guide
Ask me questions while you tour the home.