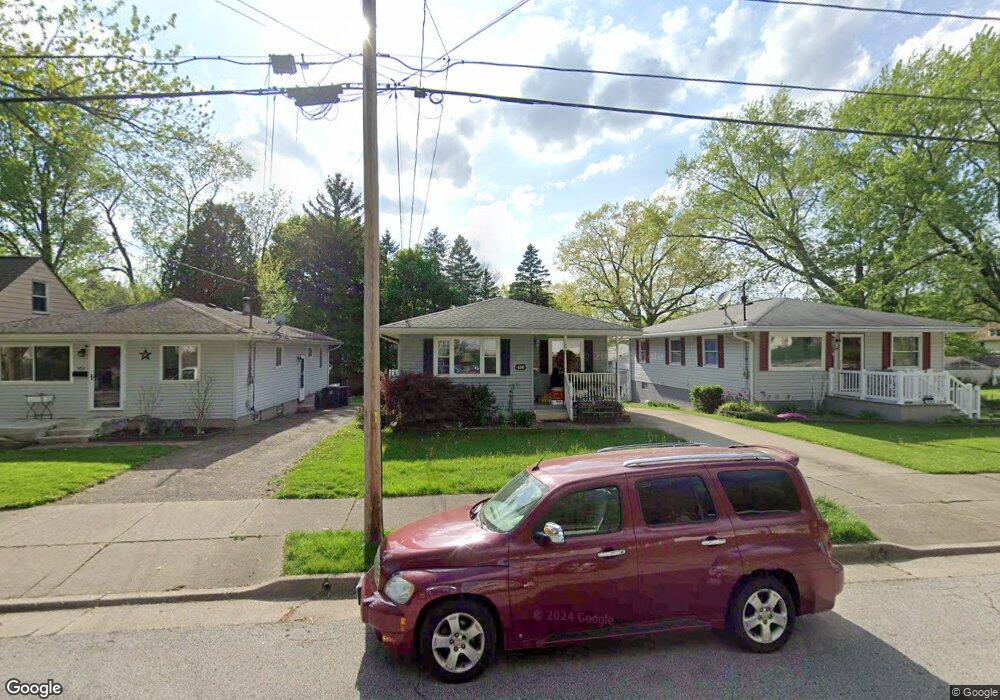
498 Baldwin Rd Akron, OH 44312
Ellet NeighborhoodEstimated Value: $145,000 - $158,000
3
Beds
1
Bath
1,016
Sq Ft
$147/Sq Ft
Est. Value
About This Home
This home is located at 498 Baldwin Rd, Akron, OH 44312 and is currently estimated at $149,409, approximately $147 per square foot. 498 Baldwin Rd is a home located in Summit County with nearby schools including Ellet High School, Akron Preparatory school, and Summit Academy Akron Elementary School.
Ownership History
Date
Name
Owned For
Owner Type
Purchase Details
Closed on
Nov 4, 2014
Sold by
Hatmaker Thomas G
Bought by
Brooks Woodrow A
Current Estimated Value
Home Financials for this Owner
Home Financials are based on the most recent Mortgage that was taken out on this home.
Original Mortgage
$52,000
Outstanding Balance
$40,140
Interest Rate
4.21%
Mortgage Type
New Conventional
Estimated Equity
$109,269
Purchase Details
Closed on
Sep 3, 2009
Sold by
Hite Betsy G
Bought by
Hatmaker Thomas G
Home Financials for this Owner
Home Financials are based on the most recent Mortgage that was taken out on this home.
Original Mortgage
$88,217
Interest Rate
5.28%
Mortgage Type
FHA
Purchase Details
Closed on
Apr 15, 2009
Sold by
Estate Of Robert J Hite
Bought by
Hite Betsy G
Purchase Details
Closed on
Feb 25, 2008
Sold by
Hite Betsy G
Bought by
Hite Robert J
Purchase Details
Closed on
Sep 22, 2003
Sold by
Hite Robert J and Hite Betsy G
Bought by
Hite Betsy G
Create a Home Valuation Report for This Property
The Home Valuation Report is an in-depth analysis detailing your home's value as well as a comparison with similar homes in the area
Home Values in the Area
Average Home Value in this Area
Purchase History
| Date | Buyer | Sale Price | Title Company |
|---|---|---|---|
| Brooks Woodrow A | $65,000 | None Available | |
| Hatmaker Thomas G | $89,900 | Cleveland Home Title | |
| Hite Betsy G | -- | None Available | |
| Hite Robert J | -- | Attorney | |
| Hite Betsy G | -- | -- |
Source: Public Records
Mortgage History
| Date | Status | Borrower | Loan Amount |
|---|---|---|---|
| Open | Brooks Woodrow A | $52,000 | |
| Previous Owner | Hatmaker Thomas G | $88,217 |
Source: Public Records
Tax History
| Year | Tax Paid | Tax Assessment Tax Assessment Total Assessment is a certain percentage of the fair market value that is determined by local assessors to be the total taxable value of land and additions on the property. | Land | Improvement |
|---|---|---|---|---|
| 2025 | $1,736 | $41,850 | $9,030 | $32,820 |
| 2024 | $1,736 | $41,850 | $9,030 | $32,820 |
| 2023 | $1,736 | $41,850 | $9,030 | $32,820 |
| 2022 | $1,555 | $31,662 | $6,689 | $24,973 |
| 2021 | $1,557 | $31,662 | $6,689 | $24,973 |
| 2020 | $1,533 | $31,660 | $6,690 | $24,970 |
| 2019 | $1,423 | $28,000 | $6,350 | $21,650 |
| 2018 | $1,404 | $28,000 | $6,350 | $21,650 |
| 2017 | $2,314 | $28,000 | $6,350 | $21,650 |
| 2016 | $1,587 | $29,470 | $6,350 | $23,120 |
| 2015 | $2,314 | $29,470 | $6,350 | $23,120 |
| 2014 | $2,187 | $29,470 | $6,350 | $23,120 |
| 2013 | $2,087 | $28,650 | $6,350 | $22,300 |
Source: Public Records
Map
Nearby Homes
- 1863 Harding Ave
- 472 Stephens Rd
- 1628 Merrill Ave
- 536 Hillman Rd
- 577 Essex St
- 1832 Springfield Center Rd
- 581 Stanley Rd
- 274 Fulmer Ave
- 487 Hilbish Ave
- 260 Prairie Dr
- 2226 Quayle Dr
- 2199 Kelty Ct Unit 29
- 111 Akers Ave
- 640 Plainfield Rd
- 529 Anderson Ave
- 2077 Coleman Ave
- 20 Verdun Dr
- 805 Utica Ave
- 2331 E Market St
- 110 Eastholm Ave
- 494 Baldwin Rd
- 502 Baldwin Rd
- 506 Baldwin Rd
- 515 Massillon Rd
- 511 Massillon Rd
- 519 Massillon Rd
- 519 Massillon Rd
- 519 Massillon Rd
- 519 Massillon Rd
- 507 Massillon Rd
- 497 Baldwin Rd
- 520 Baldwin Rd
- 493 Baldwin Rd
- 503 Baldwin Rd
- 489 Baldwin Rd
- 478 Baldwin Rd
- 503 Massillon Rd
- 509 Baldwin Rd
- 535 Massillon Rd
- 481 Baldwin Rd
Your Personal Tour Guide
Ask me questions while you tour the home.