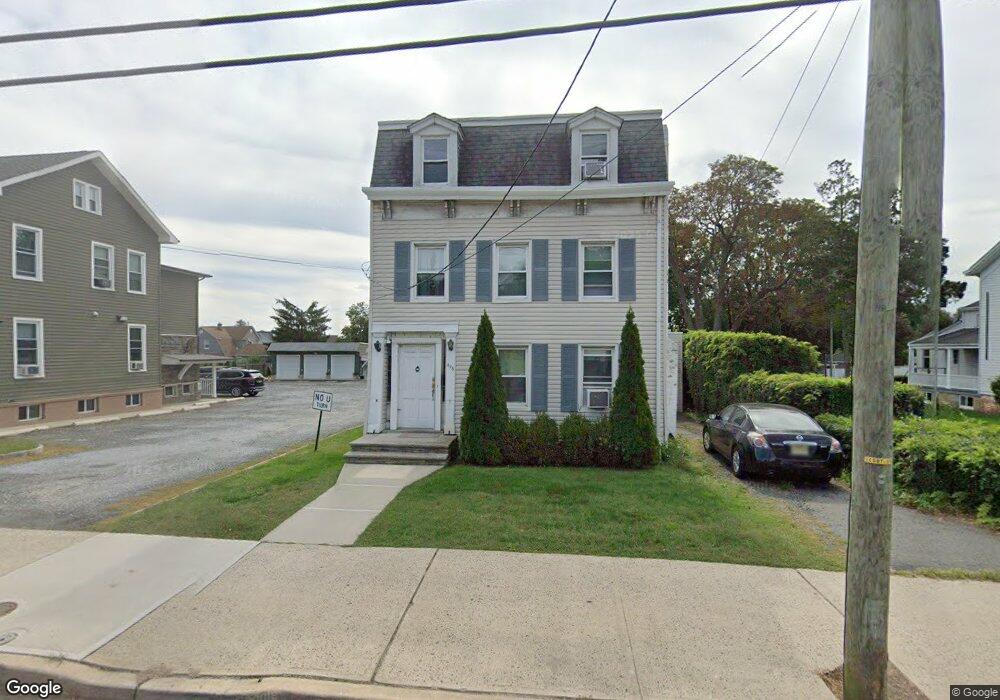
498 Broadway Long Branch, NJ 07740
Estimated Value: $612,000 - $737,000
5
Beds
3
Baths
2,153
Sq Ft
$311/Sq Ft
Est. Value
About This Home
This home is located at 498 Broadway, Long Branch, NJ 07740 and is currently estimated at $668,788, approximately $310 per square foot. 498 Broadway is a home located in Monmouth County with nearby schools including Long Branch High School and Holy Trinity School.
Ownership History
Date
Name
Owned For
Owner Type
Purchase Details
Closed on
Oct 7, 2021
Sold by
Scalise Gabriele and Scalise Francesca
Bought by
Scalise Anthony and Scalise Rachael Yost
Current Estimated Value
Purchase Details
Closed on
Jan 17, 2008
Sold by
Acerra Antoinette C
Bought by
Scalise Gabriele and Scalise Francesca
Home Financials for this Owner
Home Financials are based on the most recent Mortgage that was taken out on this home.
Original Mortgage
$219,000
Interest Rate
6.17%
Mortgage Type
Purchase Money Mortgage
Create a Home Valuation Report for This Property
The Home Valuation Report is an in-depth analysis detailing your home's value as well as a comparison with similar homes in the area
Home Values in the Area
Average Home Value in this Area
Purchase History
| Date | Buyer | Sale Price | Title Company |
|---|---|---|---|
| Scalise Anthony | $465,000 | Foundation Title Llc | |
| Scalise Gabriele | $319,000 | Red Bank Title Agency Inc |
Source: Public Records
Mortgage History
| Date | Status | Borrower | Loan Amount |
|---|---|---|---|
| Previous Owner | Scalise Gabriele | $219,000 |
Source: Public Records
Tax History Compared to Growth
Tax History
| Year | Tax Paid | Tax Assessment Tax Assessment Total Assessment is a certain percentage of the fair market value that is determined by local assessors to be the total taxable value of land and additions on the property. | Land | Improvement |
|---|---|---|---|---|
| 2025 | $7,072 | $479,000 | $181,800 | $297,200 |
| 2024 | $6,897 | $460,100 | $175,800 | $284,300 |
| 2023 | $6,897 | $444,100 | $172,800 | $271,300 |
| 2022 | $7,690 | $402,800 | $163,800 | $239,000 |
| 2021 | $7,690 | $384,300 | $160,800 | $223,500 |
| 2020 | $7,804 | $373,400 | $151,200 | $222,200 |
| 2019 | $7,506 | $357,100 | $145,200 | $211,900 |
| 2018 | $7,627 | $360,800 | $142,200 | $218,600 |
| 2017 | $7,337 | $356,000 | $141,600 | $214,400 |
| 2016 | $7,108 | $351,700 | $142,800 | $208,900 |
| 2015 | $5,683 | $255,200 | $154,500 | $100,700 |
| 2014 | $6,328 | $299,500 | $210,200 | $89,300 |
Source: Public Records
Map
Nearby Homes
- 399 Willow Ave
- 28 Norwood Ave
- 119 Washington St
- 88 Norwood Ave
- 298 Poole Ave
- 14 Slocum Place
- 39 Slocum Place
- 631 Irving Place
- 565 Joline Ave
- 364 Westwood Ave Unit 39
- 364 Westwood Ave Unit 71
- 364 Westwood Ave Unit 21
- 144 Westwood Ave
- 40 N 5th Ave
- 303 Westwood Ave
- 572 Jay St
- 215 Cleveland Ave
- 377 Westwood Ave
- 238 Branchport Ave
- 401 Joline Ave
- 504 Broadway
- 508 Broadway
- 11 Morrell St
- 501 Broadway
- 501 Broadway Unit 3
- 501 Broadway Unit 2
- 501 Broadway Unit Rear Office
- 501 Broadway Unit 2
- 501 Broadway Unit 1
- 15 Morrell St
- 503 Broadway
- 503 Exchange Place
- 495 Broadway
- 493 Exchange Place
- 440 Willow Ave
- 489 Broadway
- 17 Morrell St
- 436 Willow Ave
- 19 Morrell St
- 21 Morrell St