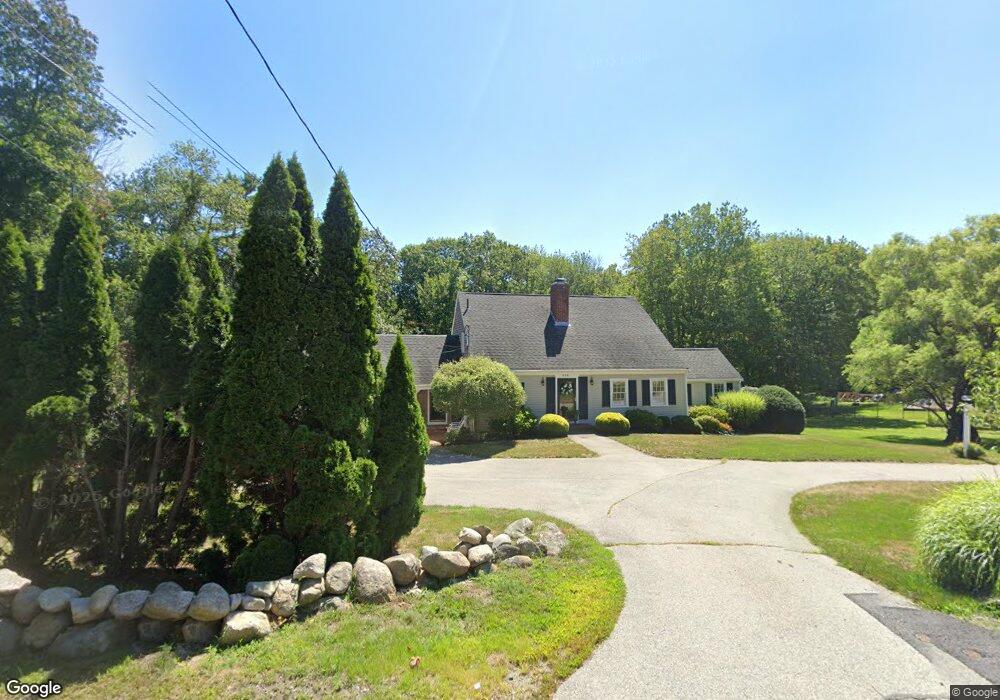
498 Main St Norwell, MA 02061
Estimated Value: $960,000 - $1,248,000
3
Beds
3
Baths
2,535
Sq Ft
$446/Sq Ft
Est. Value
About This Home
This home is located at 498 Main St, Norwell, MA 02061 and is currently estimated at $1,131,567, approximately $446 per square foot. 498 Main St is a home located in Plymouth County with nearby schools including Grace Farrar Cole Elementary School, Norwell Middle School, and Norwell High School.
Ownership History
Date
Name
Owned For
Owner Type
Purchase Details
Closed on
May 15, 2023
Sold by
Naymie George J and Naymie Lucille
Bought by
Naymie Ft
Current Estimated Value
Purchase Details
Closed on
Aug 15, 1972
Bought by
Naymie George J and Naymie Lucille
Create a Home Valuation Report for This Property
The Home Valuation Report is an in-depth analysis detailing your home's value as well as a comparison with similar homes in the area
Home Values in the Area
Average Home Value in this Area
Purchase History
| Date | Buyer | Sale Price | Title Company |
|---|---|---|---|
| Naymie Ft | -- | None Available | |
| Naymie Ft | -- | None Available | |
| Naymie George J | -- | -- |
Source: Public Records
Mortgage History
| Date | Status | Borrower | Loan Amount |
|---|---|---|---|
| Previous Owner | Naymie George J | $236,500 | |
| Previous Owner | Naymie George J | $25,000 | |
| Previous Owner | Naymie George J | $270,000 |
Source: Public Records
Tax History Compared to Growth
Tax History
| Year | Tax Paid | Tax Assessment Tax Assessment Total Assessment is a certain percentage of the fair market value that is determined by local assessors to be the total taxable value of land and additions on the property. | Land | Improvement |
|---|---|---|---|---|
| 2025 | $12,971 | $992,400 | $439,300 | $553,100 |
| 2024 | $12,113 | $899,900 | $414,400 | $485,500 |
| 2023 | $11,425 | $747,200 | $304,200 | $443,000 |
| 2022 | $11,152 | $671,000 | $277,500 | $393,500 |
| 2021 | $11,609 | $685,300 | $291,900 | $393,400 |
| 2020 | $11,119 | $668,600 | $297,200 | $371,400 |
| 2019 | $10,791 | $658,000 | $286,600 | $371,400 |
| 2018 | $10,647 | $651,600 | $291,900 | $359,700 |
| 2017 | $9,633 | $585,600 | $278,600 | $307,000 |
| 2016 | $9,888 | $599,300 | $278,600 | $320,700 |
| 2015 | $9,286 | $562,800 | $278,600 | $284,200 |
| 2014 | $9,581 | $585,300 | $292,200 | $293,100 |
Source: Public Records
Map
Nearby Homes
- 451 Main St
- 479 Clapp Brook Rd
- 205 Pleasant St
- 179 Lincoln St
- 2 Curtis Farm Rd
- 21 Norwell Ave
- Lot 26 Webster Farm Way
- Lot 4 Webster Farm Way
- Lot 24 Webster Farm Way
- Lot 22 Webster Farm Way
- Lot 1 Webster Farm Way
- 27 Henrys Ln
- 60 Old Oaken Bucket Rd
- 301 Pine St
- 72 Chittenden Ln
- 0 Mt Blue Unit 73374335
- 731 Grove St
- 250 River St
- 260 River St
- 0 Mount Blue St