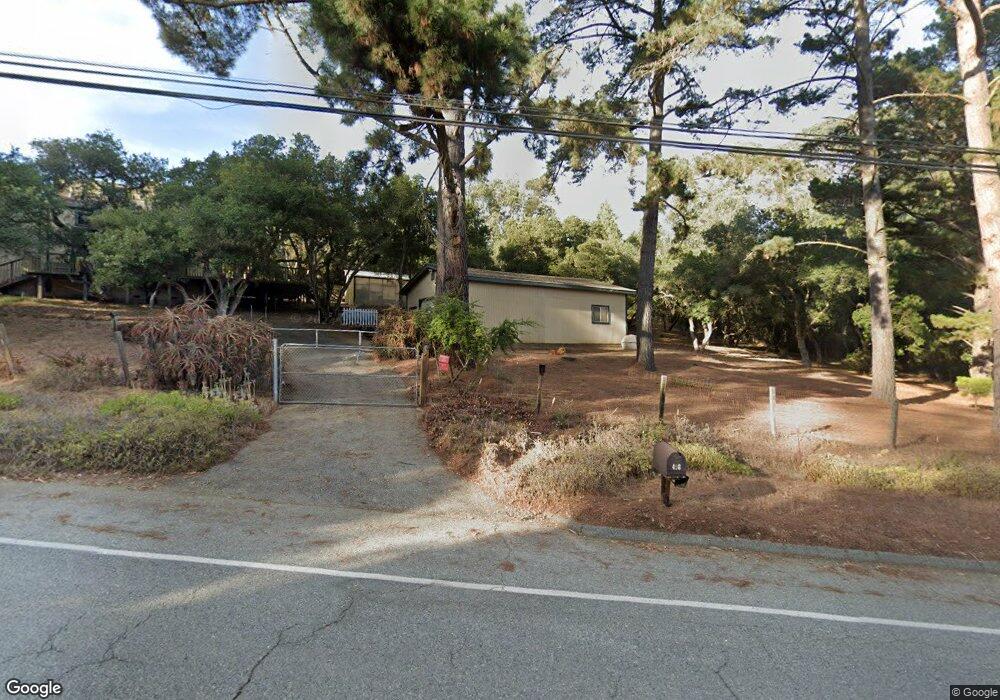
498 Trabing Rd Watsonville, CA 95076
Estimated Value: $835,000 - $1,359,000
2
Beds
2
Baths
1,256
Sq Ft
$854/Sq Ft
Est. Value
About This Home
This home is located at 498 Trabing Rd, Watsonville, CA 95076 and is currently estimated at $1,072,932, approximately $854 per square foot. 498 Trabing Rd is a home located in Santa Cruz County with nearby schools including Calabasas Elementary School, Aptos Junior High School, and Aptos High School.
Ownership History
Date
Name
Owned For
Owner Type
Purchase Details
Closed on
Nov 21, 2002
Sold by
Troyer Tara J and Troyer Tara Jeanne
Bought by
Troyer Tara J
Current Estimated Value
Home Financials for this Owner
Home Financials are based on the most recent Mortgage that was taken out on this home.
Original Mortgage
$300,700
Outstanding Balance
$116,472
Interest Rate
5%
Estimated Equity
$956,460
Purchase Details
Closed on
Jul 17, 2002
Sold by
Troyer Tara Jeanne
Bought by
Troyer Tara Jeanne
Purchase Details
Closed on
Jul 3, 2001
Sold by
Flannery Brian D
Bought by
Troyer Tara J
Home Financials for this Owner
Home Financials are based on the most recent Mortgage that was taken out on this home.
Original Mortgage
$300,000
Interest Rate
8.03%
Purchase Details
Closed on
Aug 6, 1998
Sold by
David Troyer Tara Jeanne and Flannery Brian
Bought by
Flannery Brian D and Troyer Tara J
Home Financials for this Owner
Home Financials are based on the most recent Mortgage that was taken out on this home.
Original Mortgage
$145,000
Interest Rate
6.95%
Create a Home Valuation Report for This Property
The Home Valuation Report is an in-depth analysis detailing your home's value as well as a comparison with similar homes in the area
Home Values in the Area
Average Home Value in this Area
Purchase History
| Date | Buyer | Sale Price | Title Company |
|---|---|---|---|
| Troyer Tara J | -- | First American Title Co | |
| Troyer Tara Jeanne | -- | -- | |
| Troyer Tara J | -- | Old Republic Title Company | |
| Flannery Brian D | $17,000 | Fidelity National Title Co |
Source: Public Records
Mortgage History
| Date | Status | Borrower | Loan Amount |
|---|---|---|---|
| Open | Troyer Tara J | $300,700 | |
| Closed | Troyer Tara J | $300,000 | |
| Previous Owner | Flannery Brian D | $145,000 |
Source: Public Records
Tax History
| Year | Tax Paid | Tax Assessment Tax Assessment Total Assessment is a certain percentage of the fair market value that is determined by local assessors to be the total taxable value of land and additions on the property. | Land | Improvement |
|---|---|---|---|---|
| 2025 | $4,890 | $398,305 | $227,117 | $171,188 |
| 2023 | $4,801 | $382,838 | $218,297 | $164,541 |
| 2022 | $4,699 | $375,331 | $214,017 | $161,314 |
| 2021 | $4,488 | $367,972 | $209,821 | $158,151 |
| 2020 | $4,423 | $364,199 | $207,669 | $156,530 |
| 2019 | $4,200 | $357,057 | $203,597 | $153,460 |
| 2018 | $4,096 | $350,056 | $199,605 | $150,451 |
| 2017 | $4,062 | $343,192 | $195,691 | $147,501 |
| 2016 | $3,958 | $336,463 | $191,854 | $144,609 |
| 2015 | $3,897 | $331,409 | $188,972 | $142,437 |
| 2014 | $3,814 | $324,917 | $185,270 | $139,647 |
Source: Public Records
Map
Nearby Homes
- 371 Calabasas Rd
- 14 Orange Blossom Way
- 21 Crest Ln
- 144 Holm Rd Unit 55
- 144 Holm Rd Unit 93
- 144 Holm Rd Unit 120
- 144 Holm Rd Unit 112
- 40 Eileen St
- 253 Green Meadow Dr Unit C
- 100 Crest Dr
- 229 Silver Leaf Dr Unit B
- 706 San Andreas Rd
- 145 Lindero Dr
- 216 Green Meadow Dr Unit C
- 600 Sea View Terrace
- 501 S Green Valley Rd Unit 89
- 10 Pera Dr Unit 10
- 900 E Bel Mar Dr
- 69 Contento Dr
- 52 Winding Way