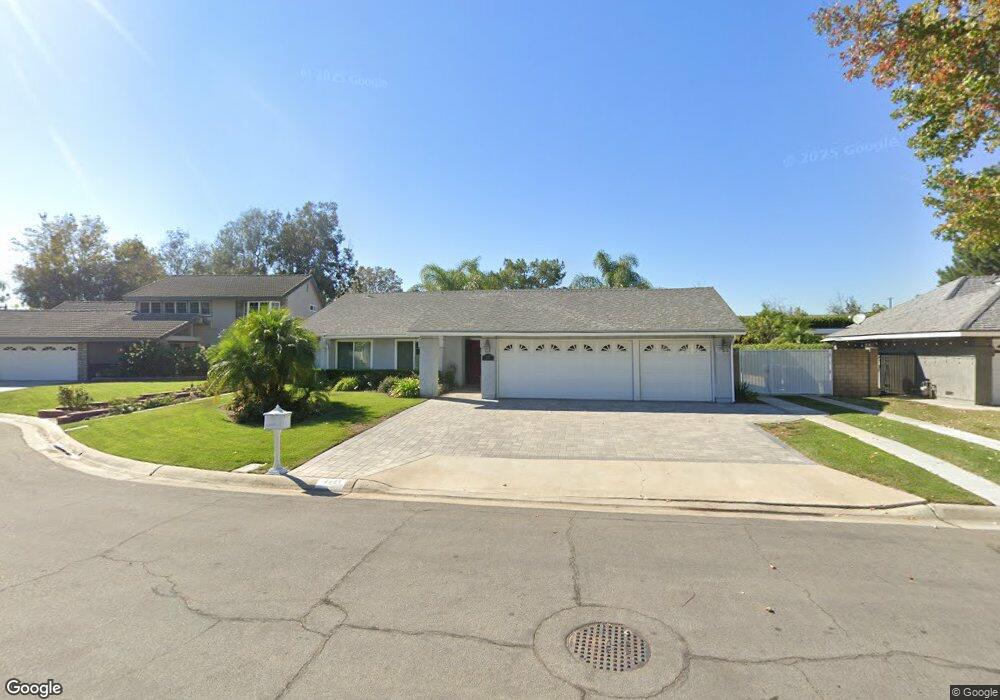
4981 Oak Tree Ct Yorba Linda, CA 92886
Estimated Value: $1,240,485 - $1,425,000
3
Beds
2
Baths
1,682
Sq Ft
$793/Sq Ft
Est. Value
About This Home
This home is located at 4981 Oak Tree Ct, Yorba Linda, CA 92886 and is currently estimated at $1,333,621, approximately $792 per square foot. 4981 Oak Tree Ct is a home located in Orange County with nearby schools including Mabel M. Paine Elementary, Yorba Linda Middle School, and Yorba Linda High School.
Ownership History
Date
Name
Owned For
Owner Type
Purchase Details
Closed on
Oct 1, 2015
Sold by
Harms David and Harms Fay
Bought by
David & Fay Harms Revocable Trust
Current Estimated Value
Purchase Details
Closed on
Aug 10, 2010
Sold by
Cascia Angelo
Bought by
Harms David and Harms Fay
Home Financials for this Owner
Home Financials are based on the most recent Mortgage that was taken out on this home.
Original Mortgage
$222,000
Outstanding Balance
$146,094
Interest Rate
4.45%
Mortgage Type
New Conventional
Estimated Equity
$1,187,527
Purchase Details
Closed on
Dec 17, 2004
Sold by
Cascia Geraldine
Bought by
Cascia Geraldine and Cascia Trust
Home Financials for this Owner
Home Financials are based on the most recent Mortgage that was taken out on this home.
Original Mortgage
$241,412
Interest Rate
5.7%
Mortgage Type
New Conventional
Create a Home Valuation Report for This Property
The Home Valuation Report is an in-depth analysis detailing your home's value as well as a comparison with similar homes in the area
Home Values in the Area
Average Home Value in this Area
Purchase History
| Date | Buyer | Sale Price | Title Company |
|---|---|---|---|
| David & Fay Harms Revocable Trust | -- | None Available | |
| Harms David | $535,000 | Ticor Title Tustin Orange Co | |
| Cascia Geraldine | -- | Commonwealth Land Title Co | |
| Cascia Geraldine R | -- | Commonwealth Land Title Co |
Source: Public Records
Mortgage History
| Date | Status | Borrower | Loan Amount |
|---|---|---|---|
| Open | Harms David | $222,000 | |
| Previous Owner | Cascia Geraldine R | $241,412 |
Source: Public Records
Tax History Compared to Growth
Tax History
| Year | Tax Paid | Tax Assessment Tax Assessment Total Assessment is a certain percentage of the fair market value that is determined by local assessors to be the total taxable value of land and additions on the property. | Land | Improvement |
|---|---|---|---|---|
| 2025 | $3,677 | $292,511 | $119,258 | $173,253 |
| 2024 | $3,677 | $286,776 | $116,920 | $169,856 |
| 2023 | $3,601 | $281,153 | $114,627 | $166,526 |
| 2022 | $3,552 | $275,641 | $112,380 | $163,261 |
| 2021 | $3,485 | $270,237 | $110,177 | $160,060 |
| 2020 | $3,377 | $267,467 | $109,048 | $158,419 |
| 2019 | $3,266 | $262,223 | $106,910 | $155,313 |
| 2018 | $3,224 | $257,082 | $104,814 | $152,268 |
| 2017 | $3,173 | $252,042 | $102,759 | $149,283 |
| 2016 | $3,111 | $247,100 | $100,744 | $146,356 |
| 2015 | $3,184 | $253,588 | $99,231 | $154,357 |
| 2014 | $3,093 | $248,621 | $97,287 | $151,334 |
Source: Public Records
Map
Nearby Homes
- 4951 Oak Tree Ct
- 4788 Lakeview Ave Unit 48
- 4760 Lakeview Ave
- 4712 Yorba Ln
- 5152 Lakeview Ave
- 18931 Gordon Ln
- 5245 Grandview Ave
- 19072 Lamplight Ln
- 18701 Piper Place
- 5335 Grandview Ave
- 5031 Fairway View Dr
- 5371 Grandview Ave
- 18571 Buena Vista Ave
- 18302 Piper Place
- 18083 Burke Ln
- 18534 Cobblestone Ct
- 18044 Burke Ln
- 4845 Eisenhower Ct
- 18568 Arbor Gate Ln
- 4241 Dorthea St
- 4971 Oak Tree Ct
- 4991 Oak Tree Ct
- 4961 Oak Tree Ct
- 4999 Oak Tree Ct
- 4968 Oak Tree Ct
- 4988 Oak Tree Ct
- 4998 Oak Tree Ct
- 4958 Oak Tree Ct
- 4948 Oak Tree Ct
- 4941 Oak Tree Ct
- 4972 Avocado Ave
- 4962 Avocado Ave
- 4938 Oak Tree Ct
- 4892 Avocado Ave
- 4931 Oak Tree Ct
- 4928 Oak Tree Ct
- 5053 Avocado Cir Unit 1
- 5055 Avocado Cir Unit 2
- 18559 Yorba Linda Blvd
- 18553 Yorba Linda Blvd