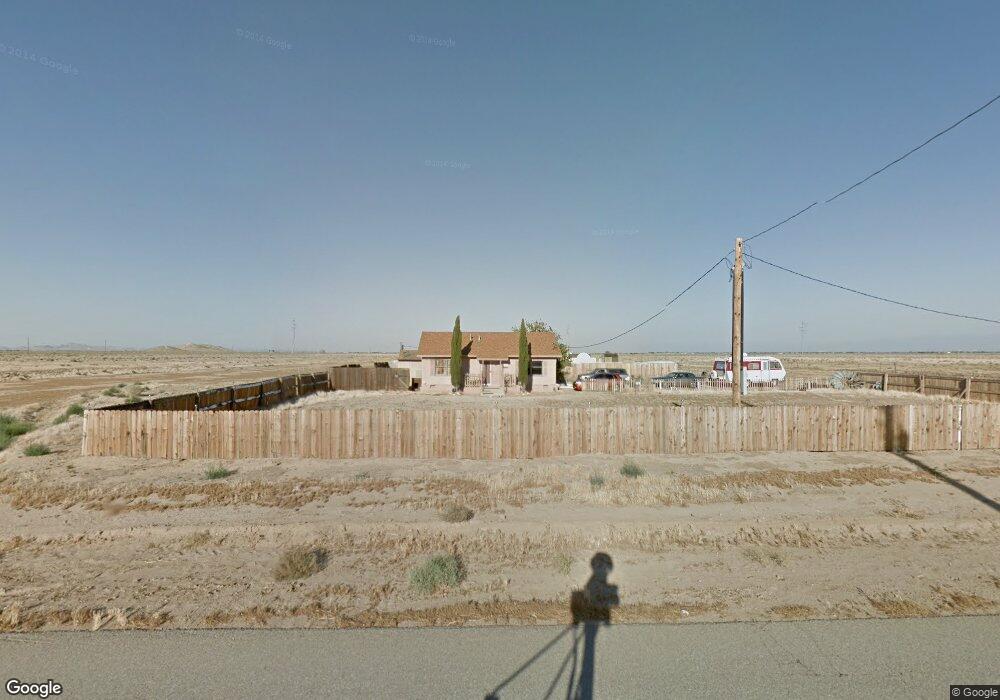
49846 110th St W Lancaster, CA 93536
Northwest Antelope Valley NeighborhoodEstimated Value: $323,175 - $591,000
1
Bed
1
Bath
910
Sq Ft
$461/Sq Ft
Est. Value
About This Home
This home is located at 49846 110th St W, Lancaster, CA 93536 and is currently estimated at $419,794, approximately $461 per square foot. 49846 110th St W is a home located in Los Angeles County with nearby schools including Del Sur Senior Elementary School and Lancaster High School.
Ownership History
Date
Name
Owned For
Owner Type
Purchase Details
Closed on
Feb 1, 2013
Sold by
Rodriguez Rosario G
Bought by
Redmayne Donna A
Current Estimated Value
Purchase Details
Closed on
Jun 10, 2010
Sold by
Ethell Pauline
Bought by
Rodriguez Rosario G
Purchase Details
Closed on
Mar 28, 2007
Sold by
Ethell Donald E
Bought by
Ethell Pauline
Purchase Details
Closed on
Mar 27, 2007
Sold by
Ethell Donald E
Bought by
Ethell Pauline
Purchase Details
Closed on
Mar 9, 2005
Sold by
Ethell Donald E
Bought by
Ethell Donald E
Home Financials for this Owner
Home Financials are based on the most recent Mortgage that was taken out on this home.
Original Mortgage
$90,000
Interest Rate
5.92%
Mortgage Type
New Conventional
Purchase Details
Closed on
Jun 24, 2004
Sold by
Schneiderman Hali A
Bought by
Ethell Donald E
Purchase Details
Closed on
Feb 5, 1999
Sold by
Ethell James L
Bought by
Schneiderman Hali Ann
Purchase Details
Closed on
Jan 31, 1996
Sold by
Ethell Donald Eugene
Bought by
Ethell James
Create a Home Valuation Report for This Property
The Home Valuation Report is an in-depth analysis detailing your home's value as well as a comparison with similar homes in the area
Home Values in the Area
Average Home Value in this Area
Purchase History
| Date | Buyer | Sale Price | Title Company |
|---|---|---|---|
| Redmayne Donna A | -- | None Available | |
| Rodriguez Rosario G | -- | None Available | |
| Ethell Pauline | -- | None Available | |
| Ethell Pauline | -- | None Available | |
| Ethell Donald E | -- | Southland Title Inland Empir | |
| Ethell Donald E | $22,000 | -- | |
| Schneiderman Hali Ann | $22,000 | -- | |
| Ethell James | -- | -- |
Source: Public Records
Mortgage History
| Date | Status | Borrower | Loan Amount |
|---|---|---|---|
| Previous Owner | Ethell Donald E | $90,000 |
Source: Public Records
Tax History
| Year | Tax Paid | Tax Assessment Tax Assessment Total Assessment is a certain percentage of the fair market value that is determined by local assessors to be the total taxable value of land and additions on the property. | Land | Improvement |
|---|---|---|---|---|
| 2025 | $2,412 | $190,702 | $47,704 | $142,998 |
| 2024 | $2,412 | $186,964 | $46,769 | $140,195 |
| 2023 | $2,390 | $183,299 | $45,852 | $137,447 |
| 2022 | $2,348 | $179,705 | $44,953 | $134,752 |
| 2021 | $2,306 | $176,182 | $44,072 | $132,110 |
| 2020 | $2,277 | $174,377 | $43,621 | $130,756 |
| 2019 | $2,236 | $170,959 | $42,766 | $128,193 |
| 2018 | $2,230 | $167,608 | $41,928 | $125,680 |
| 2016 | $2,098 | $161,100 | $40,300 | $120,800 |
| 2015 | $1,254 | $90,749 | $26,847 | $63,902 |
| 2014 | $1,283 | $88,973 | $26,322 | $62,651 |
Source: Public Records
Map
Nearby Homes
- 0 W 113th St Unit 25006446
- 0 Cor Avenue B14 113 Stw Unit 26002147
- 49630 105th St W
- 0 Avenue C-8
- 0 105th St W & Ave C-10
- 0 105th St West and B10
- 0 Vic Avenue C12 102nd Stw
- 12000 W Avenue B-14
- 0 112th Street West Avenue B2
- 0 105th St West & Ave B2 Unit 26000038
- 11200 W Avenue C-6
- 0 W Cor Avenue C-12
- 0 W Ave Unit C14
- 0 Ave C Vic 97 St W
- 0
- 9800 W Noble Lake Dr
- 0 100th St W & Ave A-12 Unit 26002626
- B6 Rachmaninov St
- 0 120 St W and D6 Unit 26002237
- 0 Cor Ave B2 122 Stw Unit 25005880
- 0 110th St W & Ave C-2 Unit 24000309
- 0 110th St West & Ave C Unit 19011688
- 0 Ave C & 110th St W Unit 21000622
- 0 Ave C & 110th St W Unit 21010398
- 0 Cor Avenue C6 and 110th St W
- 75 W C Ave
- 11000 110th Stw West & Ave C4 Vic Ave Unit C4
- 0 Ave C Vic 78 Stw Unit SR18029693
- 0 Ave C Vic 78 Stw Unit 18001437
- 0 110th St W and Vic Ave C6
- 111xx W Vic Avenue C
- Corner 112 Stw Ave
- 0 W Vic 106 Stw Unit C3 22004159
- 0 107th St West and C4 Unit 22008100
- Corner 113 Stw Ave
- 110th St W
- 0 Ave C Near 110th St
- 0 110th St W & Ave C-8 Unit 24000497
- 0 107th St W & Ave C-8 Unit 24005832
- 0 Vic 106th St West and Ave C4
Your Personal Tour Guide
Ask me questions while you tour the home.