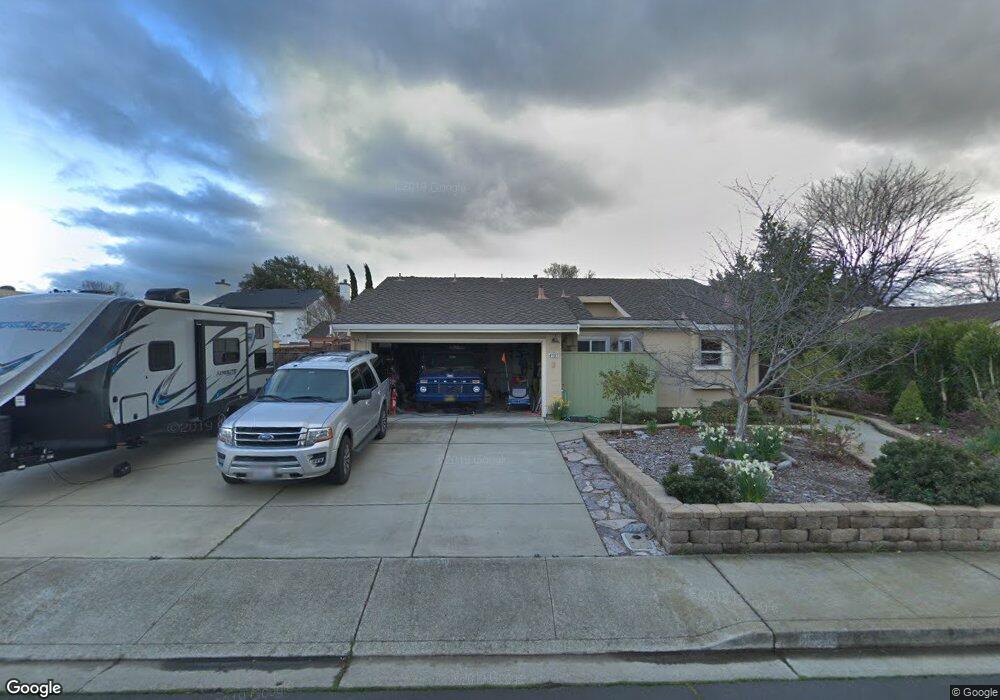
4985 Capriconus Ave Livermore, CA 94551
Springtown NeighborhoodEstimated Value: $927,000 - $965,000
3
Beds
2
Baths
1,178
Sq Ft
$803/Sq Ft
Est. Value
About This Home
This home is located at 4985 Capriconus Ave, Livermore, CA 94551 and is currently estimated at $945,972, approximately $803 per square foot. 4985 Capriconus Ave is a home located in Alameda County with nearby schools including Altamont Creek Elementary School, Andrew N. Christensen Middle School, and Livermore High School.
Ownership History
Date
Name
Owned For
Owner Type
Purchase Details
Closed on
May 7, 2018
Sold by
Heuser Christopher G and Heuser Claudia M
Bought by
Diebner William R and Diebner Andrea B
Current Estimated Value
Home Financials for this Owner
Home Financials are based on the most recent Mortgage that was taken out on this home.
Original Mortgage
$407,000
Outstanding Balance
$347,747
Interest Rate
4.44%
Mortgage Type
New Conventional
Estimated Equity
$598,225
Purchase Details
Closed on
Jan 5, 2016
Sold by
St Martin Marc A and St Martin Carmella N
Bought by
Heuser Christopher G and Heuser Claudia M
Home Financials for this Owner
Home Financials are based on the most recent Mortgage that was taken out on this home.
Original Mortgage
$481,600
Interest Rate
3.9%
Mortgage Type
New Conventional
Create a Home Valuation Report for This Property
The Home Valuation Report is an in-depth analysis detailing your home's value as well as a comparison with similar homes in the area
Home Values in the Area
Average Home Value in this Area
Purchase History
| Date | Buyer | Sale Price | Title Company |
|---|---|---|---|
| Diebner William R | $747,000 | Chicago Title Company | |
| Heuser Christopher G | $602,000 | Chicago Title Company |
Source: Public Records
Mortgage History
| Date | Status | Borrower | Loan Amount |
|---|---|---|---|
| Open | Diebner William R | $407,000 | |
| Previous Owner | Heuser Christopher G | $481,600 |
Source: Public Records
Tax History
| Year | Tax Paid | Tax Assessment Tax Assessment Total Assessment is a certain percentage of the fair market value that is determined by local assessors to be the total taxable value of land and additions on the property. | Land | Improvement |
|---|---|---|---|---|
| 2025 | $10,525 | $842,943 | $254,983 | $594,960 |
| 2024 | $10,525 | $826,277 | $249,983 | $583,294 |
| 2023 | $10,374 | $816,941 | $245,082 | $571,859 |
| 2022 | $10,230 | $793,925 | $240,277 | $560,648 |
| 2021 | $10,027 | $778,223 | $235,567 | $549,656 |
| 2020 | $9,741 | $777,178 | $233,153 | $544,025 |
| 2019 | $9,786 | $761,940 | $228,582 | $533,358 |
| 2018 | $8,169 | $626,320 | $187,896 | $438,424 |
| 2017 | $7,961 | $614,040 | $184,212 | $429,828 |
| 2016 | $3,813 | $267,994 | $80,398 | $187,596 |
| 2015 | $3,585 | $263,970 | $79,191 | $184,779 |
| 2014 | $3,519 | $258,800 | $77,640 | $181,160 |
Source: Public Records
Map
Nearby Homes
- 1817 Bluebell Dr
- 1498 Columbine Way
- 1414 Columbine Way
- 2060 Broadmoor St
- 1279 Marigold Rd
- 4669 Golf Dr
- 4363 Golf Dr
- 1686 Rhododendron Dr
- 2013 Galloway Common
- 1264 Tulip Way
- 5612 Firestone Rd
- 1174 Central Ave
- 1426 Jayhawk Ln
- 2376 Broadmoor St
- 5833 Singing Hills Ave
- 1433 Jayhawk Ln
- 1913 Monterey Dr
- 1905 Monterey Dr
- 5941 Crestmont Ave
- 5473 Rainflower Dr
- 4997 Capriconus Ave
- 4973 Capriconus Ave
- 4970 Scenic Ave
- 4958 Scenic Ave
- 4998 Scenic Ave
- 4949 Capriconus Ave
- 1818 Aquarius St
- 4992 Lyra Ct
- 4936 Scenic Ave
- 1850 Aquarius St
- 4984 Lyra Ct
- 4911 Capriconus Ave
- 4892 Scenic Ave
- 1763 Aquarius St
- 1795 Aquarius St
- 4967 Scenic Ave
- 1807 Aquarius St
- 1731 Aquarius St
- 4906 Capriconus Ave
- 4995 Scenic Ave
Your Personal Tour Guide
Ask me questions while you tour the home.