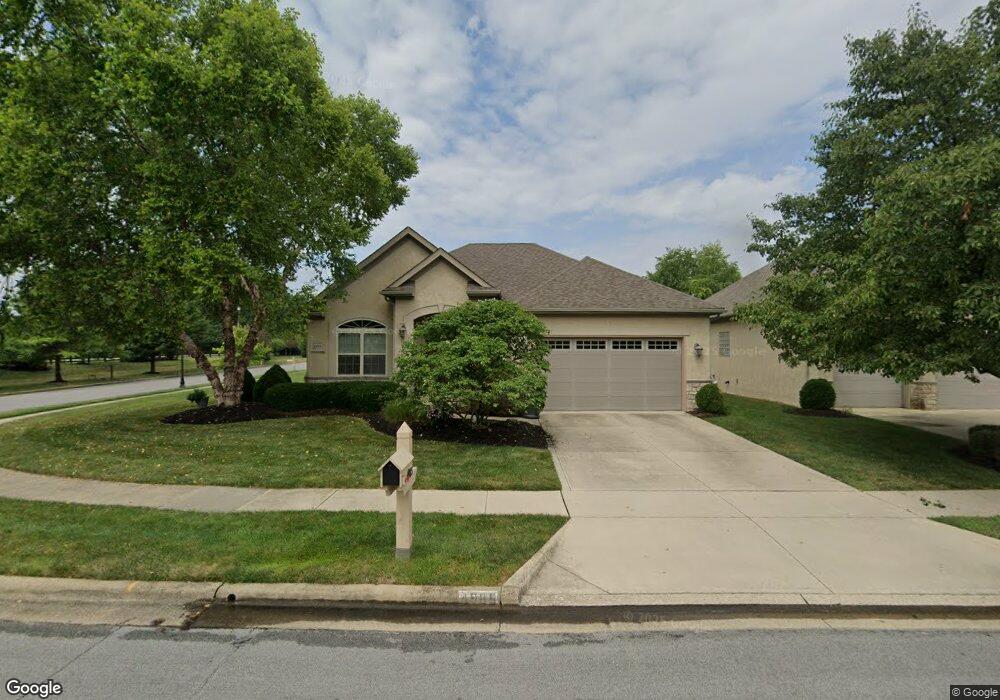
4985 Denbigh Ct Unit Lot 36 Columbus, OH 43220
Knolls West NeighborhoodEstimated Value: $614,577 - $676,000
3
Beds
3
Baths
1,786
Sq Ft
$362/Sq Ft
Est. Value
About This Home
This home is located at 4985 Denbigh Ct Unit Lot 36, Columbus, OH 43220 and is currently estimated at $646,644, approximately $362 per square foot. 4985 Denbigh Ct Unit Lot 36 is a home located in Franklin County with nearby schools including Winterset Elementary School, Ridgeview Middle School, and Centennial High School.
Ownership History
Date
Name
Owned For
Owner Type
Purchase Details
Closed on
Jun 22, 2021
Sold by
Niehoff Steven R and Niehoff Stephanie A
Bought by
Reardon Thomas and Reardon Paula
Current Estimated Value
Home Financials for this Owner
Home Financials are based on the most recent Mortgage that was taken out on this home.
Original Mortgage
$428,000
Outstanding Balance
$320,694
Interest Rate
2.2%
Mortgage Type
New Conventional
Estimated Equity
$325,950
Purchase Details
Closed on
Feb 15, 2008
Sold by
Romanelli & Hughes Building Co
Bought by
Niehott Steven R and Groce Stephanie A
Home Financials for this Owner
Home Financials are based on the most recent Mortgage that was taken out on this home.
Original Mortgage
$315,131
Interest Rate
6.11%
Mortgage Type
Purchase Money Mortgage
Purchase Details
Closed on
Feb 26, 2007
Sold by
Francisco Glen Llc
Bought by
Romanelli & Hughes Building Co
Create a Home Valuation Report for This Property
The Home Valuation Report is an in-depth analysis detailing your home's value as well as a comparison with similar homes in the area
Home Values in the Area
Average Home Value in this Area
Purchase History
| Date | Buyer | Sale Price | Title Company |
|---|---|---|---|
| Reardon Thomas | $535,000 | Stewart Title | |
| Niehott Steven R | $394,000 | Talon Group | |
| Romanelli & Hughes Building Co | $354,000 | Talon Group |
Source: Public Records
Mortgage History
| Date | Status | Borrower | Loan Amount |
|---|---|---|---|
| Open | Reardon Thomas | $428,000 | |
| Previous Owner | Niehott Steven R | $315,131 |
Source: Public Records
Tax History Compared to Growth
Tax History
| Year | Tax Paid | Tax Assessment Tax Assessment Total Assessment is a certain percentage of the fair market value that is determined by local assessors to be the total taxable value of land and additions on the property. | Land | Improvement |
|---|---|---|---|---|
| 2024 | $7,442 | $165,830 | $52,500 | $113,330 |
| 2023 | $7,347 | $165,830 | $52,500 | $113,330 |
| 2022 | $7,875 | $151,840 | $19,710 | $132,130 |
| 2021 | $7,889 | $151,840 | $19,710 | $132,130 |
| 2020 | $7,899 | $151,840 | $19,710 | $132,130 |
| 2019 | $7,485 | $123,380 | $15,750 | $107,630 |
| 2018 | $7,497 | $123,380 | $15,750 | $107,630 |
| 2017 | $7,885 | $123,380 | $15,750 | $107,630 |
| 2016 | $8,289 | $125,130 | $30,940 | $94,190 |
| 2015 | $7,525 | $125,130 | $30,940 | $94,190 |
| 2014 | $7,543 | $125,130 | $30,940 | $94,190 |
| 2013 | $3,677 | $123,655 | $29,470 | $94,185 |
Source: Public Records
Map
Nearby Homes
- 1466 Weybridge Rd
- 4818 -4820 Winterset Dr
- 1558 Denbigh Dr
- 1147 Langland Dr
- 5111 Portland St
- 1161 Bethel Rd Unit 103/104
- 5111 Schuylkill St
- 1297 Slade Ave
- 4710 Charecote Ln Unit D
- 1284 Slade Ave
- 1739 Paula Dr Unit 1739
- 4924 Reed Rd Unit B
- 1540 Slade Ave Unit 303
- 4543 Ducrest Dr
- 1046 Merrimar Cir N Unit B
- 5363 Godown Rd
- 1030 Galliton Ct Unit B
- 1835 Willoway Cir N
- 1865 Willoway Cir N Unit 1865
- 1512 Lafayette Dr Unit B
- 4985 Denbigh Ct
- 4989 Denbigh Ct
- 4981 Denbigh Ct
- 42 Denbigh Ct
- 4977 Denbigh Ct
- 1385 Denbigh Dr
- 4982 Denbigh Ct
- 4974 Denbigh Ct
- 4973 Denbigh Ct
- 1393 Denbigh Dr
- 0 Denbigh Ct
- 1401 Denbigh Dr
- 4969 Denbigh Ct
- 1348 Francisco Rd
- 1345 Denbigh Dr
- 1413 Denbigh Dr
- 1376 Denbigh Dr
- 1368 Denbigh Dr
- 1384 Denbigh Dr
- 0 Denbigh Dr