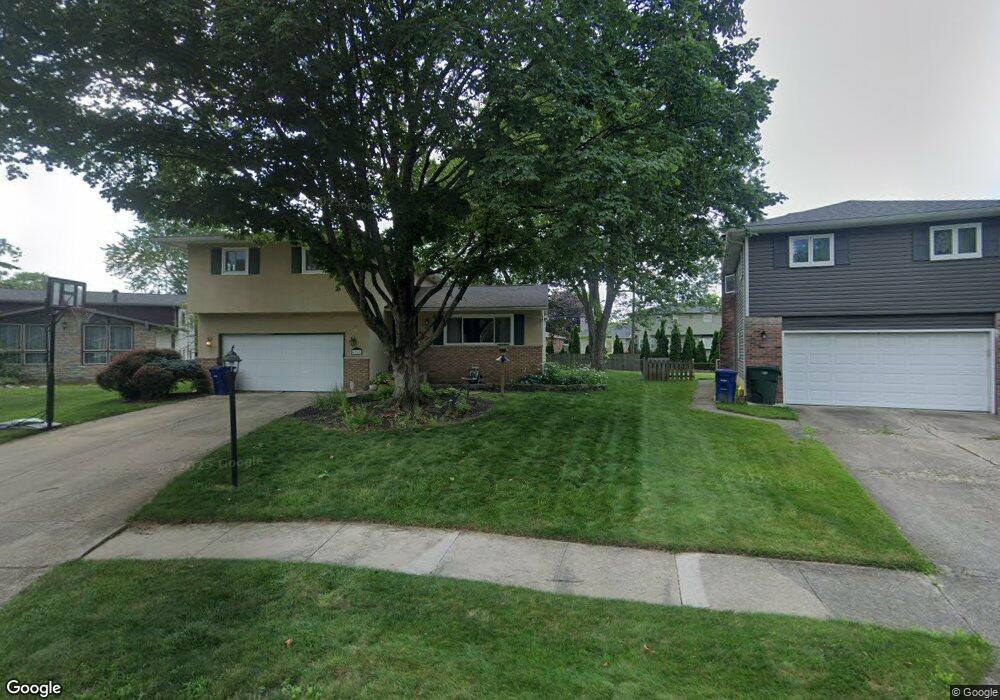
4987 Ivyhill Loop W Columbus, OH 43229
Forest Park East NeighborhoodEstimated Value: $291,933 - $326,000
3
Beds
3
Baths
1,746
Sq Ft
$180/Sq Ft
Est. Value
About This Home
This home is located at 4987 Ivyhill Loop W, Columbus, OH 43229 and is currently estimated at $314,983, approximately $180 per square foot. 4987 Ivyhill Loop W is a home located in Franklin County with nearby schools including Parkmoor Elementary School, Woodward Park Middle School, and Northland High School.
Ownership History
Date
Name
Owned For
Owner Type
Purchase Details
Closed on
Oct 12, 2005
Sold by
Estabrook Bard L
Bought by
Mcelroy Daniel B and Mcelroy Suzanne M
Current Estimated Value
Home Financials for this Owner
Home Financials are based on the most recent Mortgage that was taken out on this home.
Original Mortgage
$119,900
Outstanding Balance
$64,338
Interest Rate
5.8%
Mortgage Type
Fannie Mae Freddie Mac
Estimated Equity
$250,645
Purchase Details
Closed on
Jun 23, 1994
Sold by
Kleckler Bruce A
Bought by
Bard L Estabrook
Home Financials for this Owner
Home Financials are based on the most recent Mortgage that was taken out on this home.
Original Mortgage
$101,650
Interest Rate
8.62%
Mortgage Type
New Conventional
Purchase Details
Closed on
Aug 30, 1991
Create a Home Valuation Report for This Property
The Home Valuation Report is an in-depth analysis detailing your home's value as well as a comparison with similar homes in the area
Home Values in the Area
Average Home Value in this Area
Purchase History
| Date | Buyer | Sale Price | Title Company |
|---|---|---|---|
| Mcelroy Daniel B | $149,900 | Talon Group | |
| Bard L Estabrook | $107,000 | -- | |
| -- | $94,000 | -- |
Source: Public Records
Mortgage History
| Date | Status | Borrower | Loan Amount |
|---|---|---|---|
| Open | Mcelroy Daniel B | $119,900 | |
| Closed | Bard L Estabrook | $101,650 |
Source: Public Records
Tax History Compared to Growth
Tax History
| Year | Tax Paid | Tax Assessment Tax Assessment Total Assessment is a certain percentage of the fair market value that is determined by local assessors to be the total taxable value of land and additions on the property. | Land | Improvement |
|---|---|---|---|---|
| 2024 | $3,569 | $79,520 | $22,610 | $56,910 |
| 2023 | $3,523 | $79,520 | $22,610 | $56,910 |
| 2022 | $2,702 | $52,090 | $13,620 | $38,470 |
| 2021 | $2,706 | $52,090 | $13,620 | $38,470 |
| 2020 | $2,710 | $52,090 | $13,620 | $38,470 |
| 2019 | $2,508 | $41,340 | $10,890 | $30,450 |
| 2018 | $2,463 | $41,340 | $10,890 | $30,450 |
| 2017 | $2,588 | $41,340 | $10,890 | $30,450 |
| 2016 | $2,669 | $40,290 | $9,700 | $30,590 |
| 2015 | $2,423 | $40,290 | $9,700 | $30,590 |
| 2014 | $2,429 | $40,290 | $9,700 | $30,590 |
| 2013 | $1,261 | $42,420 | $10,220 | $32,200 |
Source: Public Records
Map
Nearby Homes
- 5022 Sienna Ln
- 4923 Karl Rd Unit 4925
- 1704 Riverbirch Dr
- 1485 Norma Rd
- 4852 Colonel Perry Dr
- 4816 Bourke Rd
- 5231 Arrowood Ct
- 1385 Thurell Rd
- 4800 Bourke Rd
- 4815 Bourke Rd
- 4761 Colonel Perry Dr
- 1493 Boxwood Dr
- 1414 Alvina Dr
- 4791 Bourke Rd
- 5124 Northcliff Loop W
- 2033 Brittany Rd
- 4714 Ascot Dr
- 2058 Northcliff Dr
- 4849 Heatherton Dr
- 4904 Almont Dr
- 4995 Ivyhill Loop W
- 1679 Ivyhill Loop S
- 4986 Shadycrest Rd
- 4994 Shadycrest Rd
- 5003 Ivyhill Loop W
- 1685 Ivyhill Loop S
- 4978 Shadycrest Rd
- 5004 Shadycrest Rd
- 1692 Ivyhill Loop S
- 4966 Shadycrest Rd
- 1693 Ivyhill Loop S
- 5012 Shadycrest Rd
- 5011 Ivyhill Loop W
- 5011 Ivyhill Loop N
- 1670 Norma Rd
- 1678 Norma Rd
- 1702 Ivyhill Loop S
- 1695 Ivyhill Loop N
- 1686 Norma Rd
- 1705 Ivyhill Loop S