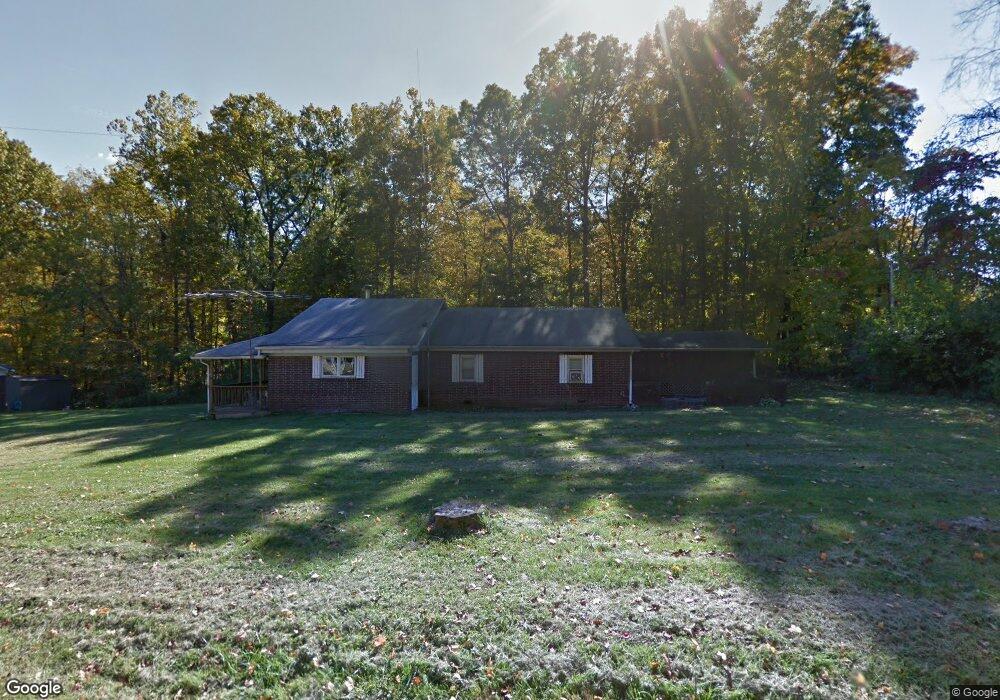
4988 Minks Rd Cloverdale, IN 46120
Estimated Value: $95,000 - $193,000
3
Beds
1
Bath
1,496
Sq Ft
$97/Sq Ft
Est. Value
About This Home
This home is located at 4988 Minks Rd, Cloverdale, IN 46120 and is currently estimated at $145,531, approximately $97 per square foot. 4988 Minks Rd is a home located in Owen County with nearby schools including Cloverdale Elementary School, Cloverdale Middle School, and Cloverdale High School.
Ownership History
Date
Name
Owned For
Owner Type
Purchase Details
Closed on
Sep 27, 2023
Sold by
Riley Childrens Foundation
Bought by
Cook David W
Current Estimated Value
Purchase Details
Closed on
Oct 13, 2020
Sold by
Neiner Andrew L
Bought by
Wasson George W
Purchase Details
Closed on
Nov 14, 2018
Sold by
Arrington Christopher
Bought by
Neiner Andrew L
Purchase Details
Closed on
Nov 9, 2018
Sold by
Christopher Arrington
Bought by
Neiner Andrew L
Purchase Details
Closed on
Aug 14, 2007
Sold by
Household Finance Corp Iii
Bought by
Neiner Andrew L and Neiner Tamra Marie
Home Financials for this Owner
Home Financials are based on the most recent Mortgage that was taken out on this home.
Original Mortgage
$61,224
Interest Rate
6.63%
Mortgage Type
New Conventional
Purchase Details
Closed on
Apr 19, 2007
Sold by
Minks Brenda K
Bought by
Household Finance Corp Iii
Create a Home Valuation Report for This Property
The Home Valuation Report is an in-depth analysis detailing your home's value as well as a comparison with similar homes in the area
Home Values in the Area
Average Home Value in this Area
Purchase History
| Date | Buyer | Sale Price | Title Company |
|---|---|---|---|
| Cook David W | -- | None Listed On Document | |
| Riley Childrens Foundation | -- | None Listed On Document | |
| Wasson George W | $58,887 | Abstract & Title Of Putnam Cou | |
| Neiner Andrew L | -- | None Available | |
| Neiner Andrew L | -- | -- | |
| Neiner Andrew L | -- | None Available | |
| Household Finance Corp Iii | $38,361 | None Available |
Source: Public Records
Mortgage History
| Date | Status | Borrower | Loan Amount |
|---|---|---|---|
| Previous Owner | Neiner Andrew L | $61,224 |
Source: Public Records
Tax History Compared to Growth
Tax History
| Year | Tax Paid | Tax Assessment Tax Assessment Total Assessment is a certain percentage of the fair market value that is determined by local assessors to be the total taxable value of land and additions on the property. | Land | Improvement |
|---|---|---|---|---|
| 2024 | $1,125 | $76,400 | $15,800 | $60,600 |
| 2023 | $1,242 | $113,000 | $15,800 | $97,200 |
| 2022 | $2,072 | $119,100 | $15,800 | $103,300 |
| 2021 | $1,505 | $75,300 | $15,800 | $59,500 |
| 2020 | $399 | $73,800 | $15,800 | $58,000 |
| 2019 | $403 | $71,800 | $15,800 | $56,000 |
| 2018 | $326 | $67,700 | $15,800 | $51,900 |
| 2017 | $1,608 | $80,400 | $35,600 | $44,800 |
| 2016 | $1,583 | $78,600 | $33,700 | $44,900 |
| 2014 | $1,527 | $77,200 | $33,700 | $43,500 |
| 2013 | -- | $76,600 | $33,600 | $43,000 |
Source: Public Records
Map
Nearby Homes
- 11760 Indiana 243
- 5012 Pond Rd
- 12151 Gaddis Ln
- 4336 Almond Rd
- 11107 E Dogwood
- 5264 N Macadam Dr
- 5280 S Macadam Dr
- 0 Pr 1075 N
- 5384 Private Road 1070 N
- 10717 SW Boat Dock Rd
- 10844 Private Road 570 W
- 5916 State Road 42
- 11213 Oak Grove Church Rd
- 10801 Buckskin Rd
- 4555 Wolf Trail
- 9643 Lasuer Rd
- 1564 W County Road 1050 S
- 10302 S Co Road 10 E
- 9958 Parker Ln
- 3595 W Ivanwald Dr
- 4950 Mitten Dr
- 1 Cataract Highland Loop Rd
- 9 Cataract Highland Loop Rd
- 4880 Minks Rd
- 4926 Mitten Dr
- 4984 Mitten Dr
- 0 Dallas Rd Unit TRACT 3 21738026
- 0 Dallas Rd
- Lot 24B & 21 Dallas Rd
- 11979 Cataract Highland Loop Rd
- 11979 Highland Loop Rd
- 11987 Indiana 243
- 11979 Cataract Highland Lo Rd
- 11987 State Highway 243
- 11924 Dallas Rd
- 11887 Dallas Rd
- 11901 Cataract Highland Loop Rd
- 11901 Cataract Highland Loop Rd
- 11972 State Highway 243
- 4981 Mitten Dr