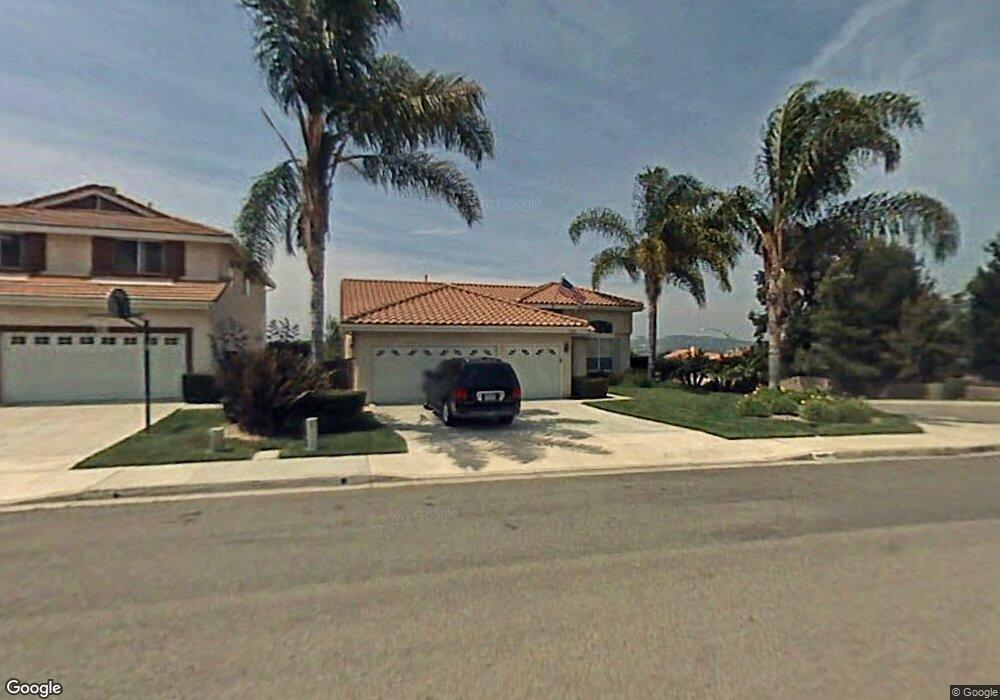
4988 Overlook Dr Oceanside, CA 92057
Guajome NeighborhoodEstimated Value: $1,016,000 - $1,123,000
4
Beds
2
Baths
2,025
Sq Ft
$523/Sq Ft
Est. Value
About This Home
This home is located at 4988 Overlook Dr, Oceanside, CA 92057 and is currently estimated at $1,060,057, approximately $523 per square foot. 4988 Overlook Dr is a home located in San Diego County with nearby schools including Alamosa Park Elementary School, Roosevelt Middle School, and Vista High School.
Ownership History
Date
Name
Owned For
Owner Type
Purchase Details
Closed on
Mar 29, 2021
Sold by
Baessler Olga
Bought by
Baessler Ernest J
Current Estimated Value
Purchase Details
Closed on
May 12, 2016
Sold by
Baessler Ernest and Baessler Olga
Bought by
1997 Baessler Family Trust and Baessler Olga
Purchase Details
Closed on
Oct 26, 2015
Sold by
Arterburn Garret
Bought by
Baessler Family Trust and Baessler Olga
Purchase Details
Closed on
Mar 3, 2006
Sold by
Kaplanek Ruth
Bought by
Arterburn Ii Garrett
Home Financials for this Owner
Home Financials are based on the most recent Mortgage that was taken out on this home.
Original Mortgage
$300,000
Interest Rate
6.18%
Mortgage Type
Fannie Mae Freddie Mac
Purchase Details
Closed on
Dec 16, 2005
Sold by
Kaplanek Ruth W
Bought by
Kaplanek Ruth
Purchase Details
Closed on
Jan 27, 1997
Sold by
Kaplanek Gerald J and Kaplanek Ruth W
Bought by
Kaplanek Gerald J and Kaplanek Ruth W
Purchase Details
Closed on
Dec 29, 1992
Create a Home Valuation Report for This Property
The Home Valuation Report is an in-depth analysis detailing your home's value as well as a comparison with similar homes in the area
Home Values in the Area
Average Home Value in this Area
Purchase History
| Date | Buyer | Sale Price | Title Company |
|---|---|---|---|
| Baessler Ernest J | -- | -- | |
| 1997 Baessler Family Trust | -- | None Available | |
| Baessler Family Trust | $540,000 | Title365 | |
| Arterburn Ii Garrett | $650,000 | California Title Company | |
| Kaplanek Ruth | -- | None Available | |
| Kaplanek Gerald J | -- | -- | |
| -- | $212,200 | -- |
Source: Public Records
Mortgage History
| Date | Status | Borrower | Loan Amount |
|---|---|---|---|
| Previous Owner | Arterburn Ii Garrett | $300,000 |
Source: Public Records
Tax History
| Year | Tax Paid | Tax Assessment Tax Assessment Total Assessment is a certain percentage of the fair market value that is determined by local assessors to be the total taxable value of land and additions on the property. | Land | Improvement |
|---|---|---|---|---|
| 2025 | $6,909 | $639,243 | $181,466 | $457,777 |
| 2024 | $6,909 | $626,709 | $177,908 | $448,801 |
| 2023 | $6,744 | $614,421 | $174,420 | $440,001 |
| 2022 | $6,731 | $602,374 | $171,000 | $431,374 |
| 2021 | $6,579 | $590,564 | $167,648 | $422,916 |
| 2020 | $6,549 | $584,509 | $165,929 | $418,580 |
| 2019 | $6,446 | $573,049 | $162,676 | $410,373 |
| 2018 | $6,137 | $561,814 | $159,487 | $402,327 |
| 2017 | $6,035 | $550,799 | $156,360 | $394,439 |
| 2016 | $5,908 | $540,000 | $153,295 | $386,705 |
| 2015 | $1,051 | $85,931 | $24,394 | $61,537 |
| 2014 | $1,033 | $84,249 | $23,917 | $60,332 |
Source: Public Records
Map
Nearby Homes
- 4802 Baroque Terrace
- 838 Masters Dr
- 1216 Woodview Dr
- 997 Masters Dr
- 1852 Red Willow Way
- 4885 Baroque Terrace
- 652 Montage Rd
- 761 Masters Dr
- 872 Oro Grande St
- 5216 Palmera Dr
- 1560 Via Botero
- 5005 Codorniz Way Unit 8
- 1423 Mountain Meadow Dr
- 4740 Via Escala
- 5524 Giovanni Way
- 1275 Natoma Way Unit B
- 255 Flame Tree Place
- 4791 Macadamia Ct
- 1020 Turnstone Way
- 4733 Dalea Place
- 4980 Overlook Dr
- 4991 Frazee Rd
- 4983 Frazee Rd
- 4972 Overlook Dr
- 5008 Overlook Dr
- 4975 Frazee Rd
- 5007 Frazee Rd
- 5003 Overlook Dr
- 4964 Overlook Dr
- 4991 Overlook Dr
- 5018 Overlook Dr
- 5011 Overlook Dr
- 4965 Frazee Rd
- 5015 Frazee Rd
- 4985 Overlook Dr
- 5025 Overlook Dr
- 4950 Overlook Dr
- 4955 Frazee Rd
- 4977 Overlook Dr
- 5023 Frazee Rd
Your Personal Tour Guide
Ask me questions while you tour the home.