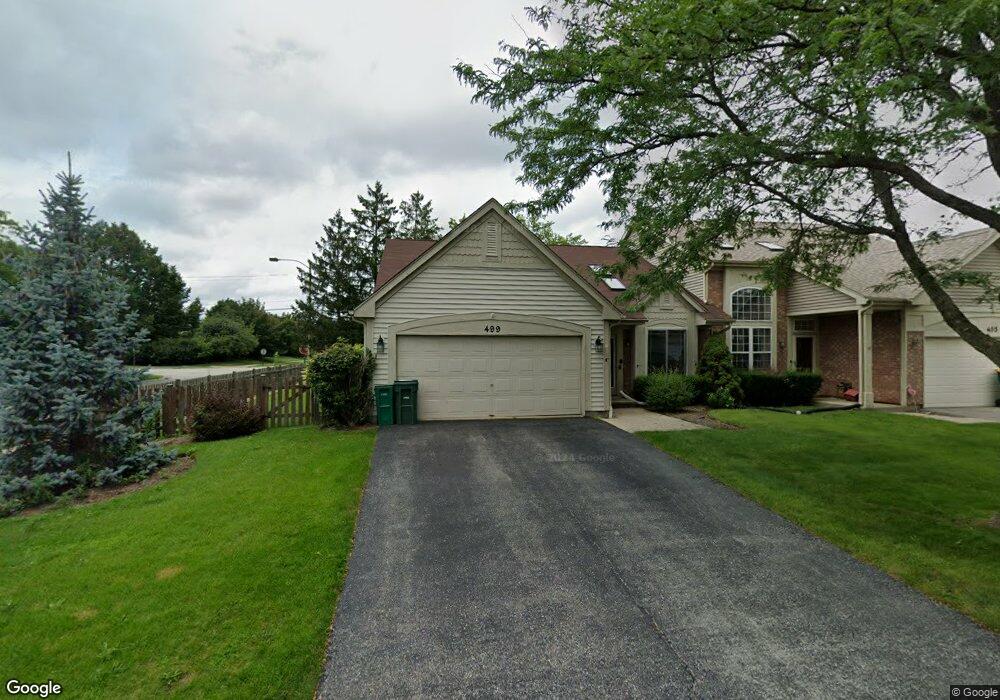
499 Attenborough Way Grayslake, IL 60030
Estimated Value: $273,000 - $350,000
3
Beds
2
Baths
1,462
Sq Ft
$213/Sq Ft
Est. Value
About This Home
This home is located at 499 Attenborough Way, Grayslake, IL 60030 and is currently estimated at $311,355, approximately $212 per square foot. 499 Attenborough Way is a home located in Lake County with nearby schools including Woodland Primary School, Woodland Elementary School, and Woodland Intermediate School.
Ownership History
Date
Name
Owned For
Owner Type
Purchase Details
Closed on
Feb 20, 2013
Sold by
Sekulich Starr A
Bought by
Sekulich Sandra D
Current Estimated Value
Home Financials for this Owner
Home Financials are based on the most recent Mortgage that was taken out on this home.
Original Mortgage
$100,300
Outstanding Balance
$70,792
Interest Rate
3.62%
Mortgage Type
New Conventional
Estimated Equity
$240,563
Purchase Details
Closed on
Jun 28, 2002
Sold by
Rasmussen Nancy A
Bought by
Sekulich Sandra D and Sekulich Starr A
Home Financials for this Owner
Home Financials are based on the most recent Mortgage that was taken out on this home.
Original Mortgage
$136,000
Interest Rate
6.7%
Purchase Details
Closed on
Apr 16, 1997
Sold by
The Northern Trust Company
Bought by
Rasmussen Nancy A
Home Financials for this Owner
Home Financials are based on the most recent Mortgage that was taken out on this home.
Original Mortgage
$100,000
Interest Rate
8.27%
Create a Home Valuation Report for This Property
The Home Valuation Report is an in-depth analysis detailing your home's value as well as a comparison with similar homes in the area
Home Values in the Area
Average Home Value in this Area
Purchase History
| Date | Buyer | Sale Price | Title Company |
|---|---|---|---|
| Sekulich Sandra D | -- | Chicago Title Insurance Comp | |
| Sekulich Sandra D | $159,000 | Blackhawk Title Services | |
| Rasmussen Nancy A | $145,500 | Ticor Title Insurance Compan |
Source: Public Records
Mortgage History
| Date | Status | Borrower | Loan Amount |
|---|---|---|---|
| Open | Sekulich Sandra D | $100,300 | |
| Closed | Sekulich Sandra D | $136,000 | |
| Previous Owner | Rasmussen Nancy A | $100,000 |
Source: Public Records
Tax History Compared to Growth
Tax History
| Year | Tax Paid | Tax Assessment Tax Assessment Total Assessment is a certain percentage of the fair market value that is determined by local assessors to be the total taxable value of land and additions on the property. | Land | Improvement |
|---|---|---|---|---|
| 2024 | $8,118 | $83,260 | $23,750 | $59,510 |
| 2023 | $6,994 | $76,413 | $21,797 | $54,616 |
| 2022 | $6,994 | $68,115 | $14,397 | $53,718 |
| 2021 | $6,270 | $60,201 | $13,839 | $46,362 |
| 2020 | $6,226 | $57,279 | $13,167 | $44,112 |
| 2019 | $7,035 | $63,547 | $12,633 | $50,914 |
| 2018 | $7,188 | $65,577 | $15,459 | $50,118 |
| 2017 | $7,111 | $61,684 | $14,541 | $47,143 |
| 2016 | $6,803 | $56,941 | $13,423 | $43,518 |
| 2015 | $6,508 | $52,020 | $12,263 | $39,757 |
| 2014 | $6,252 | $49,175 | $11,282 | $37,893 |
| 2012 | $6,239 | $51,358 | $11,783 | $39,575 |
Source: Public Records
Map
Nearby Homes
- 355 Buckingham Dr
- 707 Crossland Dr
- 399 Banbury Ln
- 745 Dillon Ct
- 820 Amelia Ct
- 873 Essex Cir
- 633 Dove Ct Unit 4
- 23 Bobolink Dr
- 1045 Manchester Cir
- 618 Barron Blvd
- 1191 Hummingbird Ln
- 418 Flanders Ln
- 20295 W Washington St
- 33276 N Sunset Ave
- 33336 N Indian Ln
- 268 Normandy Ln
- 146 Westerfield Place
- 1617 Albany St
- 33978 N Lake Rd
- 18740 W Willow Point Dr
- 495 Attenborough Way
- 491 Attenborough Way
- 486 Cambridge Dr
- 487 Attenborough Way
- 490 Cambridge Dr
- 482 Cambridge Dr
- 473 Cambridge Dr Unit 1
- 478 Cambridge Dr
- 483 Attenborough Way
- 494 Attenborough Way
- 474 Cambridge Dr Unit 1
- 469 Cambridge Dr
- 490 Attenborough Way
- 1198 Blackburn Dr
- 479 Attenborough Way
- 1192 Blackburn Dr
- 1186 Blackburn Dr
- 1186 Blackburn Dr
- 1186 Blackburn Dr Unit 1186
- 486 Attenborough Way