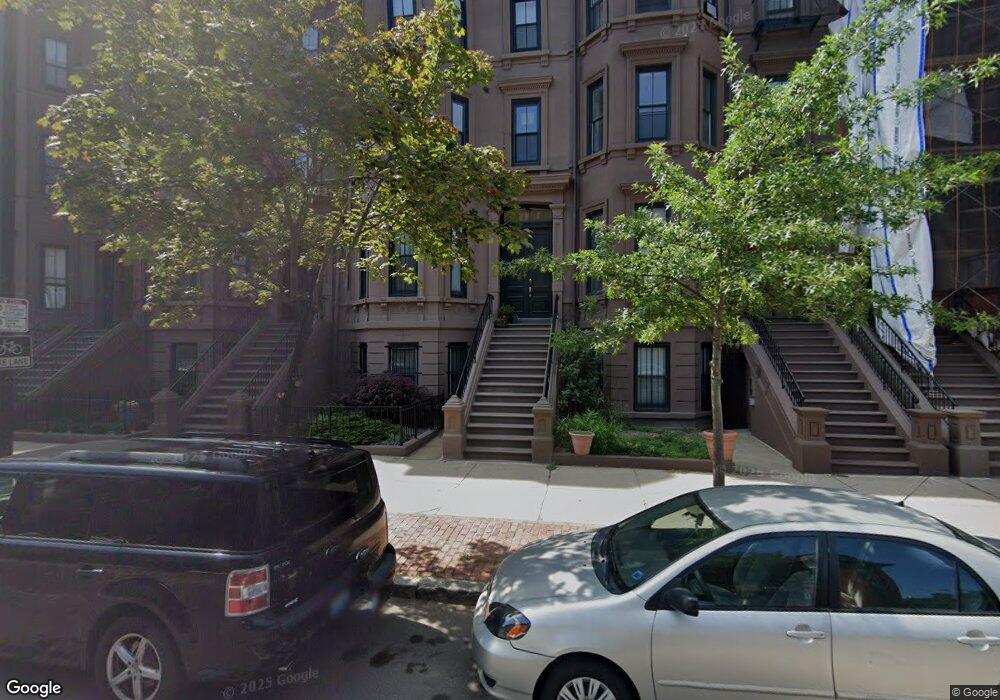
499 Columbus Ave Unit 1 Boston, MA 02118
South End NeighborhoodEstimated Value: $784,000 - $1,182,000
2
Beds
1
Bath
860
Sq Ft
$1,065/Sq Ft
Est. Value
About This Home
This home is located at 499 Columbus Ave Unit 1, Boston, MA 02118 and is currently estimated at $916,233, approximately $1,065 per square foot. 499 Columbus Ave Unit 1 is a home located in Suffolk County with nearby schools including Edward M. Kennedy Academy for Health Careers, Kingsley Montessori School, and Cathedral High School.
Ownership History
Date
Name
Owned For
Owner Type
Purchase Details
Closed on
Aug 28, 2003
Sold by
Merz Chelsea
Bought by
Hamilton Jason and West Mary E
Current Estimated Value
Home Financials for this Owner
Home Financials are based on the most recent Mortgage that was taken out on this home.
Original Mortgage
$268,000
Interest Rate
5.69%
Mortgage Type
Purchase Money Mortgage
Purchase Details
Closed on
Feb 27, 1998
Sold by
Green John R
Bought by
Merz Chelsea
Home Financials for this Owner
Home Financials are based on the most recent Mortgage that was taken out on this home.
Original Mortgage
$108,000
Interest Rate
6.85%
Mortgage Type
Purchase Money Mortgage
Purchase Details
Closed on
Jun 3, 1993
Sold by
Boston Safe Dep & Tr
Bought by
Green John R
Purchase Details
Closed on
Jan 13, 1993
Sold by
Jones Harvey D
Bought by
Bost Safe Dep & Tr
Create a Home Valuation Report for This Property
The Home Valuation Report is an in-depth analysis detailing your home's value as well as a comparison with similar homes in the area
Home Values in the Area
Average Home Value in this Area
Purchase History
| Date | Buyer | Sale Price | Title Company |
|---|---|---|---|
| Hamilton Jason | $335,116 | -- | |
| Merz Chelsea | $135,000 | -- | |
| Green John R | $55,000 | -- | |
| Bost Safe Dep & Tr | $63,000 | -- |
Source: Public Records
Mortgage History
| Date | Status | Borrower | Loan Amount |
|---|---|---|---|
| Open | Bost Safe Dep & Tr | $235,000 | |
| Closed | Bost Safe Dep & Tr | $268,000 | |
| Previous Owner | Bost Safe Dep & Tr | $108,000 |
Source: Public Records
Tax History Compared to Growth
Tax History
| Year | Tax Paid | Tax Assessment Tax Assessment Total Assessment is a certain percentage of the fair market value that is determined by local assessors to be the total taxable value of land and additions on the property. | Land | Improvement |
|---|---|---|---|---|
| 2025 | $8,140 | $702,900 | $0 | $702,900 |
| 2024 | $7,369 | $676,100 | $0 | $676,100 |
| 2023 | $7,047 | $656,100 | $0 | $656,100 |
| 2022 | $6,798 | $624,800 | $0 | $624,800 |
| 2021 | $6,667 | $624,800 | $0 | $624,800 |
| 2020 | $6,547 | $620,000 | $0 | $620,000 |
| 2019 | $6,345 | $602,000 | $0 | $602,000 |
| 2018 | $5,953 | $568,000 | $0 | $568,000 |
| 2017 | $5,676 | $536,000 | $0 | $536,000 |
| 2016 | $5,669 | $515,400 | $0 | $515,400 |
| 2015 | $5,592 | $461,800 | $0 | $461,800 |
| 2014 | $5,331 | $423,800 | $0 | $423,800 |
Source: Public Records
Map
Nearby Homes
- 68 W Rutland Square
- 56 Rutland Square
- 521 Columbus Ave Unit 4
- 41 Rutland Square Unit 1
- 30 Cumberland St
- 15 Concord Square Unit A
- 230-232 W Newton St Unit B
- 144 Worcester St Unit 2
- 128 Pembroke St Unit 2-3
- 231 W Newton St Unit 3
- 221 W Springfield St Unit 3
- 12 Concord Square Unit 1
- 15 Blackwood St Unit 2
- 8 Rutland Square Unit 2
- 8 Concord Square Unit 1
- 16 Holyoke St Unit 2
- 131 Saint Botolph St Unit 1
- 193 W Springfield St
- 10 Cumberland St Unit 10-4
- 202 W Springfield St Unit 3
- 499 Columbus Ave Unit 6
- 499 Columbus Ave Unit 5
- 499 Columbus Ave Unit 4
- 499 Columbus Ave Unit 3
- 499 Columbus Ave Unit 2
- 499 Columbus Ave Unit 499
- 499 Columbus Ave
- 499 Columbus Ave Unit B1
- 501 Columbus Ave Unit 6
- 501 Columbus Ave Unit 5
- 501 Columbus Ave Unit 4
- 501 Columbus Ave Unit 3
- 501 Columbus Ave Unit 2
- 501 Columbus Ave Unit 1
- 501 Columbus Ave Unit 501
- 501 Columbus Ave Unit 1623
- 501 Columbus Ave Unit 6 A
- 495 Columbus Ave Unit R
- 495 Columbus Ave Unit 1A
- 495 Columbus Ave Unit 4