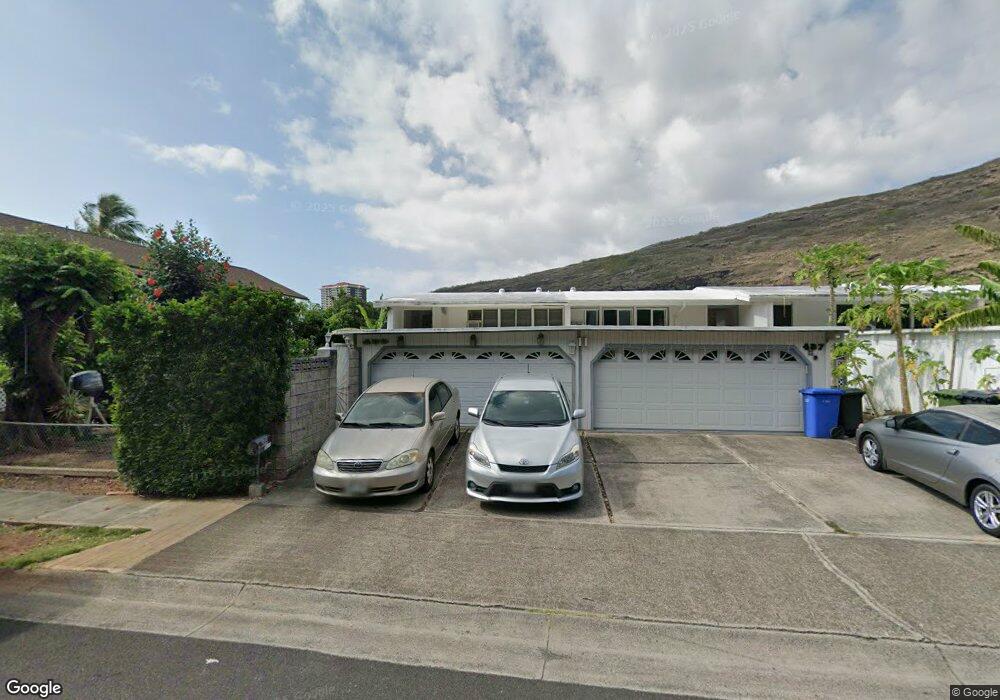
499 Kawaihae St Unit D Honolulu, HI 96825
Hawaii Kai NeighborhoodEstimated Value: $1,049,000 - $1,365,000
3
Beds
2
Baths
675
Sq Ft
$1,735/Sq Ft
Est. Value
About This Home
This home is located at 499 Kawaihae St Unit D, Honolulu, HI 96825 and is currently estimated at $1,171,351, approximately $1,735 per square foot. 499 Kawaihae St Unit D is a home located in Honolulu County with nearby schools including Haha'ione Elementary School, Niu Valley Middle School, and Honolulu Waldorf School.
Ownership History
Date
Name
Owned For
Owner Type
Purchase Details
Closed on
Dec 28, 2011
Sold by
Gubener George Juergen
Bought by
Sasaki Edward Tomoichi
Current Estimated Value
Home Financials for this Owner
Home Financials are based on the most recent Mortgage that was taken out on this home.
Original Mortgage
$393,750
Outstanding Balance
$269,685
Interest Rate
3.96%
Mortgage Type
New Conventional
Estimated Equity
$901,666
Purchase Details
Closed on
Aug 25, 2003
Sold by
Mcgarvey Blaise T and Mcgarvey Mary K W
Bought by
Gubener George Juergen
Home Financials for this Owner
Home Financials are based on the most recent Mortgage that was taken out on this home.
Original Mortgage
$157,000
Interest Rate
5.87%
Mortgage Type
Unknown
Create a Home Valuation Report for This Property
The Home Valuation Report is an in-depth analysis detailing your home's value as well as a comparison with similar homes in the area
Home Values in the Area
Average Home Value in this Area
Purchase History
| Date | Buyer | Sale Price | Title Company |
|---|---|---|---|
| Sasaki Edward Tomoichi | $525,000 | Tg | |
| Sasaki Edward Tomoichi | $525,000 | Tg | |
| Gubener George Juergen | -- | -- |
Source: Public Records
Mortgage History
| Date | Status | Borrower | Loan Amount |
|---|---|---|---|
| Open | Sasaki Edward Tomoichi | $393,750 | |
| Closed | Sasaki Edward Tomoichi | $393,750 | |
| Previous Owner | Gubener George Juergen | $157,000 |
Source: Public Records
Tax History Compared to Growth
Tax History
| Year | Tax Paid | Tax Assessment Tax Assessment Total Assessment is a certain percentage of the fair market value that is determined by local assessors to be the total taxable value of land and additions on the property. | Land | Improvement |
|---|---|---|---|---|
| 2025 | $3,175 | $1,189,900 | $535,500 | $654,400 |
| 2024 | $3,175 | $1,027,100 | $535,500 | $491,600 |
| 2023 | $2,620 | $948,700 | $535,500 | $413,200 |
| 2022 | $2,872 | $920,700 | $459,000 | $461,700 |
| 2021 | $2,598 | $842,400 | $430,300 | $412,100 |
| 2020 | $2,665 | $861,500 | $430,300 | $431,200 |
| 2019 | $2,473 | $786,500 | $420,800 | $365,700 |
| 2018 | $2,407 | $767,600 | $344,300 | $423,300 |
| 2017 | $2,449 | $779,600 | $524,800 | $254,800 |
| 2016 | $2,292 | $734,900 | $457,300 | $277,600 |
| 2015 | $2,335 | $667,200 | $442,300 | $224,900 |
| 2014 | $1,934 | $700,200 | $419,800 | $280,400 |
Source: Public Records
Map
Nearby Homes
- 486 Kawaihae St Unit C
- 6218 Keokea Place Unit C101
- 6311 Paauilo Place
- 320 Kawaihae St Unit 320
- 6307 Kaiwiki Place
- 6370 Hawaii Kai Dr Unit 19
- 6370 Hawaii Kai Dr Unit 7
- 356 Opihikao Place Unit 542
- 250 Kawaihae St Unit 9A
- 250 Kawaihae St Unit 4C
- 250 Kawaihae St Unit 1B
- 250 Kawaihae St Unit 1D
- 250 Kawaihae St Unit 16D
- 250 Kawaihae St Unit 12F
- 250 Kawaihae St Unit 2E
- 250 Kawaihae St Unit 16B
- 211 Kawaihae St Unit D1
- 125 Maunalua Ave Unit 9
- 521 Pepeekeo St Unit 8
- 553 Pepeekeo St Unit 436CA
- 495 Kawaihae St Unit B
- 497 Kawaihae St Unit C
- 493 Kawaihae St Unit 1A
- 507 Kawaihae St
- 329 Awini Place
- 335 Awini Place
- 511 Kawaihae St
- 325 Awini Place
- 485 Kawaihae St Unit F
- 479 Kawaihae St Unit C
- 483 Kawaihae St
- 477 Kawaihae St Unit B
- 475 Kawaihae St Unit A
- 339 Awini Place
- 323 Awini Place
- 481 Kawaihae St Unit D
- 489 Kawaihae St Unit H
- 487 Kawaihae St Unit G
- 489 Kawaihae St Unit A
- 345 Awini Place