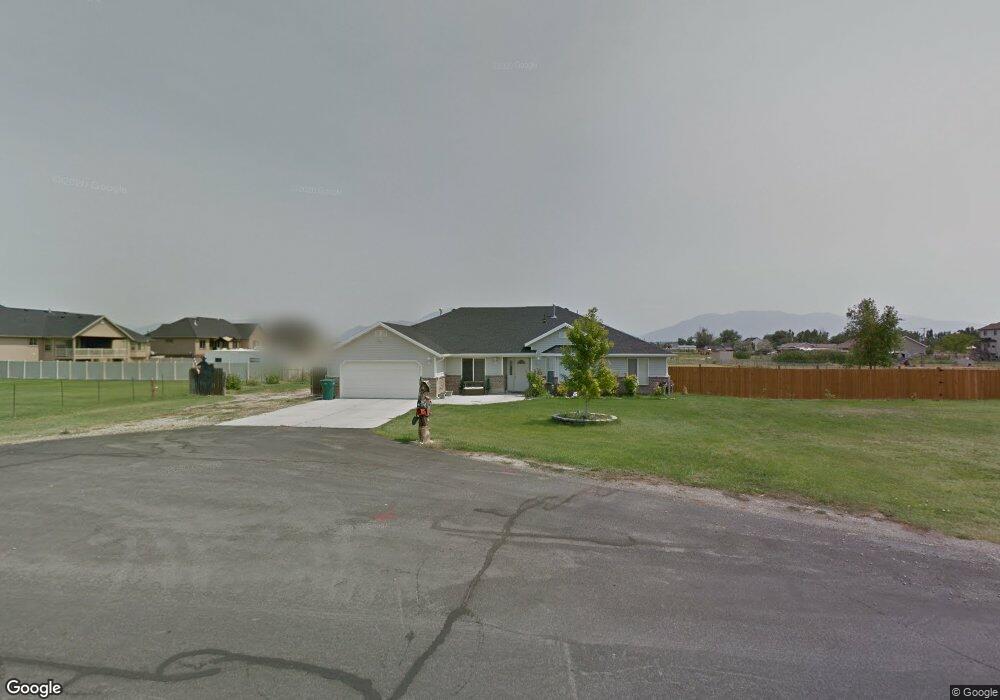
4990 S 5300 W Hooper, UT 84315
Estimated Value: $648,000 - $824,000
3
Beds
1
Bath
4,592
Sq Ft
$162/Sq Ft
Est. Value
About This Home
This home is located at 4990 S 5300 W, Hooper, UT 84315 and is currently estimated at $743,351, approximately $161 per square foot. 4990 S 5300 W is a home located in Weber County with nearby schools including Hooper Elementary School, Rocky Mountain Junior High School, and Fremont High School.
Ownership History
Date
Name
Owned For
Owner Type
Purchase Details
Closed on
Jul 30, 2012
Sold by
Carter Steve G and Carter Laurie M
Bought by
Carter Steve G and Carter Laurie M
Current Estimated Value
Home Financials for this Owner
Home Financials are based on the most recent Mortgage that was taken out on this home.
Original Mortgage
$183,000
Outstanding Balance
$29,267
Interest Rate
3.62%
Mortgage Type
New Conventional
Estimated Equity
$714,084
Purchase Details
Closed on
Jun 4, 2012
Sold by
Carter Steven G and Carter Laurie M
Bought by
S & L Carter Family Trust
Home Financials for this Owner
Home Financials are based on the most recent Mortgage that was taken out on this home.
Original Mortgage
$183,000
Outstanding Balance
$29,267
Interest Rate
3.62%
Mortgage Type
New Conventional
Estimated Equity
$714,084
Purchase Details
Closed on
Jul 3, 2002
Sold by
Harrop Homes Inc
Bought by
Carter Steven G and Carter Laurie M
Home Financials for this Owner
Home Financials are based on the most recent Mortgage that was taken out on this home.
Original Mortgage
$208,865
Interest Rate
6.78%
Purchase Details
Closed on
Dec 11, 2001
Sold by
Hancock Farms Company Partnership
Bought by
Harrop Homes Inc
Create a Home Valuation Report for This Property
The Home Valuation Report is an in-depth analysis detailing your home's value as well as a comparison with similar homes in the area
Home Values in the Area
Average Home Value in this Area
Purchase History
| Date | Buyer | Sale Price | Title Company |
|---|---|---|---|
| Carter Steve G | -- | Security Title Of Davis Coun | |
| Carter Steve G | -- | Security Title Of Davis Coun | |
| S & L Carter Family Trust | -- | None Available | |
| Carter Steven G | -- | -- | |
| Harrop Homes Inc | -- | Intermountain Title |
Source: Public Records
Mortgage History
| Date | Status | Borrower | Loan Amount |
|---|---|---|---|
| Open | Carter Steve G | $183,000 | |
| Previous Owner | Carter Steven G | $208,865 |
Source: Public Records
Tax History Compared to Growth
Tax History
| Year | Tax Paid | Tax Assessment Tax Assessment Total Assessment is a certain percentage of the fair market value that is determined by local assessors to be the total taxable value of land and additions on the property. | Land | Improvement |
|---|---|---|---|---|
| 2025 | $3,976 | $685,173 | $232,874 | $452,299 |
| 2024 | $3,830 | $374,098 | $132,580 | $241,518 |
| 2023 | $3,461 | $335,013 | $128,903 | $206,110 |
| 2022 | $3,628 | $356,400 | $104,006 | $252,394 |
| 2021 | $3,063 | $507,000 | $114,800 | $392,200 |
| 2020 | $2,885 | $437,000 | $99,800 | $337,200 |
| 2019 | $2,989 | $428,000 | $74,600 | $353,400 |
| 2018 | $3,111 | $426,000 | $74,600 | $351,400 |
| 2017 | $2,861 | $380,000 | $71,750 | $308,250 |
| 2016 | $2,726 | $196,996 | $34,000 | $162,996 |
| 2015 | $2,657 | $189,234 | $34,000 | $155,234 |
| 2014 | $2,456 | $170,170 | $34,000 | $136,170 |
Source: Public Records
Map
Nearby Homes
- 4879 S 5050 W
- 3729 S 5600 W Unit 6
- 3720 S 5600 W Unit 2
- 3719 S 5600 W Unit 7
- 4931 S 4700 W
- 5335 W 5500 S
- 5947 W 4600 S
- 3191 S 5100 St W Unit 1
- 4556 W 4950 S
- 5160 W 5725 S
- 4700 W 5500 S
- 6014 W 5300 S
- 0 W 5500 S
- 4111 S 5350 W
- 4449 W 5325 S
- 6036 W 4700 S
- 4126 S 4950 W
- 4146 S 5800 W Unit 5
- 4163 S 5800 W Unit 2
- 4909 W 5850 S
- 5255 W 4950 S
- 5275 W 4950 S
- 5235 W 4950 S
- 4968 S 5300 W
- 5217 W 4950 S
- 5217 W 4950 S Unit 105
- 4942 S 5300 W
- 5016 S 5300 W
- 5113 S 5300 W Unit 10
- 5153 S 5300 W Unit 12
- 4939 S 5225 W
- 5199 W 4950 S
- 4938 S 5300 W
- 5244 W 5100 S
- 4989 S 5300 W
- 4989 S 5300 W Unit 34
- 5315 W 5000 S
- 4985 S 5300 W Unit 22
- 4970 S 5300 W Unit 33
- 4969 S 5300 W